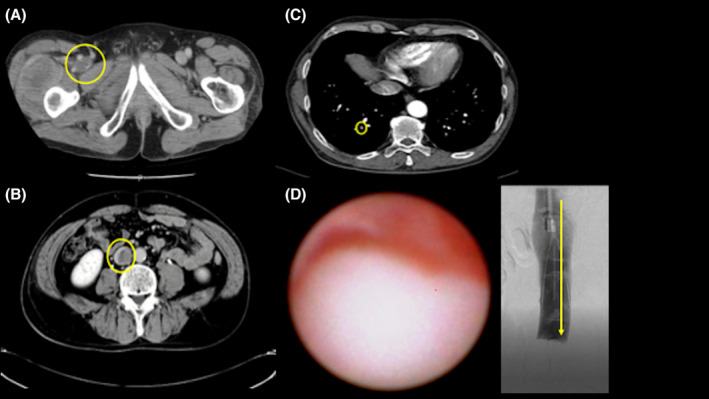
FIGURE 1.

Contrast‐enhanced computed tomography showing images (A–C) and angioscopic image of the tumor thrombus (D). (A) A contrast defect image in the right femoral vein. (B) A contrast defect image in the inferior vena cava. (C) A new pulmonary embolism in right A10. (D) The surface was smooth with white solid components.
