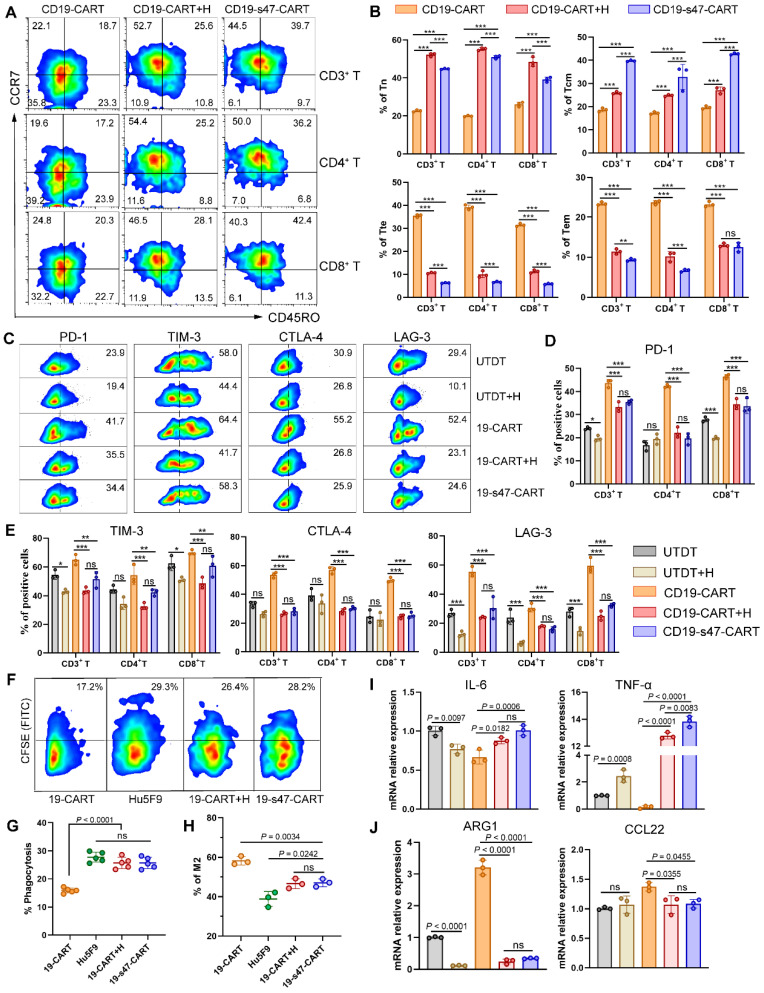
Figure 7.
Comparison between secreted anti-CD47 scFv and Hu5F9 in immunocyte regulation. (A) T cell differentiation was analyzed based on expression levels of CCR7 and CD45RO to detect proportions of Tn, Tcm, Tte and Tem. T cells were incubated with Raji cells at an E/T ratio of 1:1 for 24 h with or without Hu5F9 (200 ng/mL). Representative flow cytometry images were furnished. (B) Corresponding statistical charts of A are displayed (n = 3). (C) Percentage of PD-1-, TIM-3-, CTLA-4-, and LAG-3- positive cells among different T cells incubated with Raji at a E/T ratio of 1:1 for 24 h with or without Hu5F9 (200 ng/mL). (D-E) Statistical charts of C recapitulating the ICIs expression levels in different group (n = 3). (F) The impact of secreted anti-CD47 antibody or Hu5F9 (200 ng/mL) on macrophage phagocytosis was determined by analyzing the percentage of CFSE+ cells in CD14+ cells. (G) Statistical charts of F are shown (n = 5). (H) Percentage of CD163+ CD206+ macrophages were inspected by flow cytometry to compare the influence of secreted anti-CD47 scFv or Hu5F9 (200 ng/mL) on macrophage polarization (n = 3). (I-J) QPCR analyses were performed to determine mRNA expression levels of M1-associated genes (IL-6, TNF-α, I) and M2-associated genes (ARG1, CCL22, J) in macrophages cultured with Raji and various T cells for 24 h at a ratio of 1:1:1 in the presence or absence of Hu5F9 (200 ng/mL, n = 3). All experiments were performed at least three times with similar results and presented as the mean ± SD. One-way ANOVA with Turkey's multiple comparison test was applied for statistical analyses.

