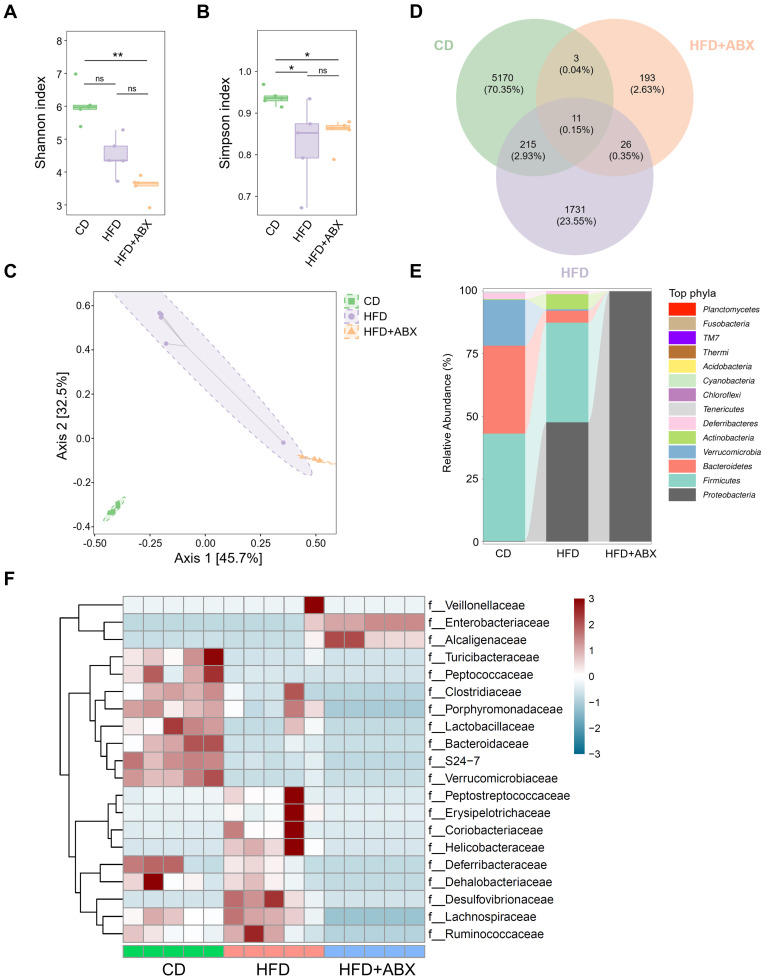
Figure 2.
The effects of HFD were correlated with the gut microbiota. (A-B) 16S-rRNA sequencing analysis of fecal samples from CD-fed, HFD-fed, and ABX-treated HFD-fed mice. Shannon (A) and Simpson (B) index analysis in each group. (C) PCoA plot from CD-fed, HFD-fed, and ABX-treated HFD-fed mouse groups based on the Bray-Curtis distance. (D) The ASV/OTU Venn diagram showing the intersection of the three groups. (E) Sankey diagram showing the relative abundance of TOP phyla. (F) Bacterial taxa observed in CD-fed, HFD-fed, and ABX-treated HFD-fed mice, shown at the family level. CD-fed, n = 5; HFD-fed, n = 5; and ABX-treated HFD-fed, n = 5. ns, no significance; *, P < 0.05; **, P < 0.01.

