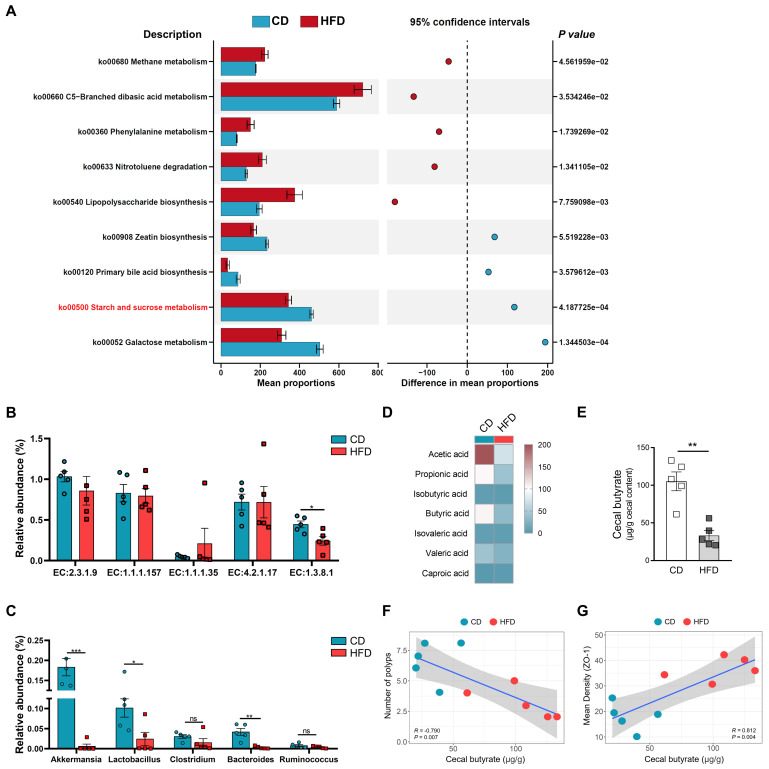
Figure 4.
HFD inhibits butyrate-producing bacteria to limit butyrate synthesis and secretion. (A) Prediction of changed butyrate production-associated KEGG pathways using Tax4fun analysis based on the SILVA database. Extended error bar plots illustrate differential representation by mean proportion and their differences based on KEGG orthologue groups, ranked by respective effect size of 0.5 thresholds in the Statistical Analysis of Metagenomic Profiles software package. Bar plots on the left side display the mean proportion of each KEGG pathway. Dot plot analysis on the right shows the differences in mean proportions between the two indicated groups using P values. (B) Butyrate synthesis-related enzymes. (C) Relative abundance of butyrate-producing microbiota and probiotics in fecal samples. (D) Heatmap of fecal SCFAs concentrations. (E) Differences in fecal butyrate concentrations between CD and HFD mice. (F) Assessment of the correlation between cecal butyrate and number of polyps. (G) Assessment of the correlation between cecal butyrate and ZO-1 expression level in the intestinal mucosa. n = 5 in each group. ns, no significance. *, P < 0.05; **, P < 0.01; ***, P < 0.001.

