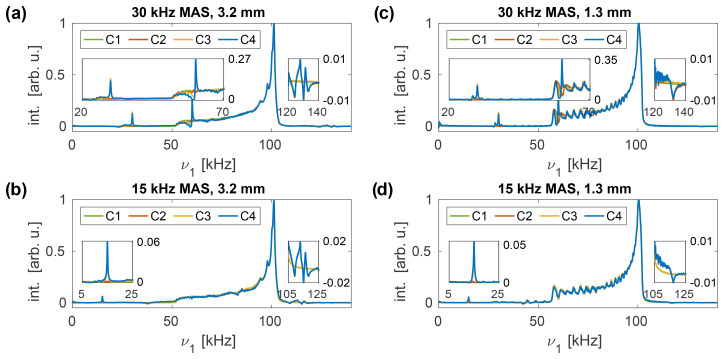
Figure 3.
Simulated nutation spectra at a resonance frequency of 600 for the 3.2 MAS probe (a, b) and the 1.3 MAS probe (c, d) for a nominal rf amplitude of 100 . A spinning frequency of 30 (a, c) and 15 (b, d) was assumed for the spectra. Sidebands at arise when rf phase modulations are taken into account (C3 and C4), while those at occur if amplitude modulations are present (C2 and C4). The amplitude modulation sidebands increase in intensity at lower MAS frequencies, whereas the phase modulation sidebands are attenuated. Both sideband families are less intense in the 1.3 probe, and the overall nutation profile is narrower, indicating an improved homogeneity of the rf distribution inside the coil.

