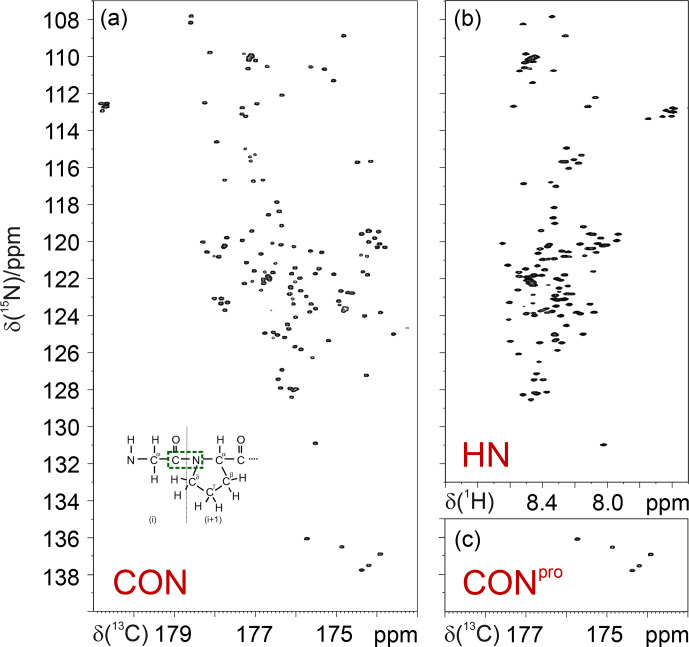
Figure 2.
Comparison of the 2D CON (a) and 2D HN (b) spectra recorded on -synuclein. The CON spectrum (c), shown below the HN panel, clearly illustrates how this experiment provides the missing information with respect to that available in the HN-detected spectrum. In the inset of the 2D CON spectrum, a scheme of a Gly dipeptide highlights the nuclei that give rise to the correlations detected in CON spectra (in green).

