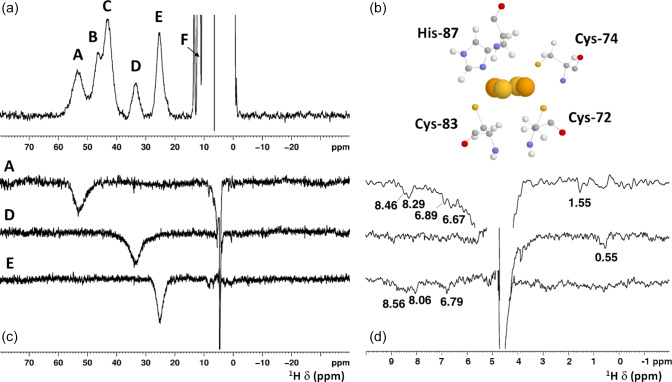
Figure 2.
(a) H NMR spectrum of oxidized mitoNEET, at 600 MHz, 283 K; (b) the cluster-binding residues are shown (PDB ID: 2QD0; Lin et al., 2007, protonated with UCSF Chimera). (c) 1D NOE difference experiments on oxidized mitoNEET at 600 MHz, 283 K. The letters indicate the signals which have been selectively irradiated to obtain the difference experiment; (d) for each of the 1D NOE difference experiments reported on (c), the 10–0 ppm region of the spectrum is shown. Peaks observed in the difference experiments are indicated by their chemical shifts.

