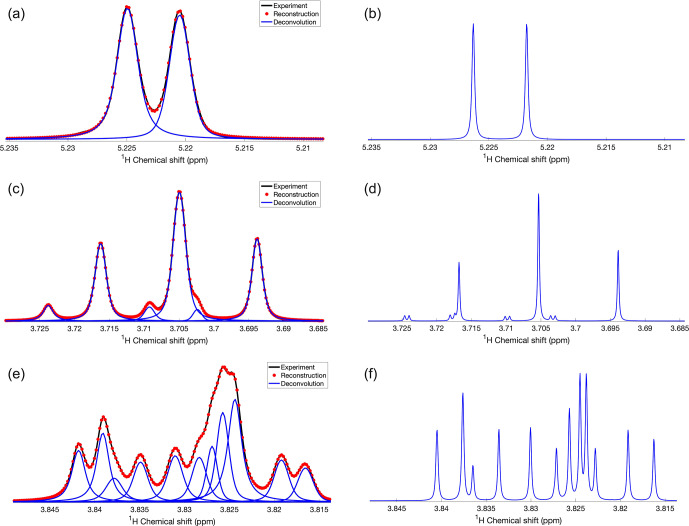
Figure 1.
Demonstration of DEEP Picker1D and Voigt Fitter1D for selected regions of a 1D spectrum of glucose. (a, c, and e) Experimental and reconstructed spectra are depicted in black lines and red dots, respectively. Deconvoluted individual peaks are depicted as blue lines. (b, d, and f) Simulated spectra including strong coupling effects with the spin Hamiltonian constructed based on parameters taken from the GISSMO website at the same field strength (850 frequency) as in the experiments. Transverse relaxation rates were uniformly set to a low value of 0.6 to obtain a very high-resolution spectrum for better comparison with DEEP Picker. Pairs of panels (a, b), (c, d), and (e, f) show the same 1D spectral regions. DEEP Picker1D and Voigt Fitter1D correctly deconvoluted the experimental spectra for the simple region (a) and more complex regions (c, e). A few peaks cannot be deconvoluted because of strong spectral overlap, such as the small peak around 3.717 in (d) and the peak around 3.823 in (f). The deconvolution by DEEP Picker1D was performed with model 2 with a PPP number of 9.

