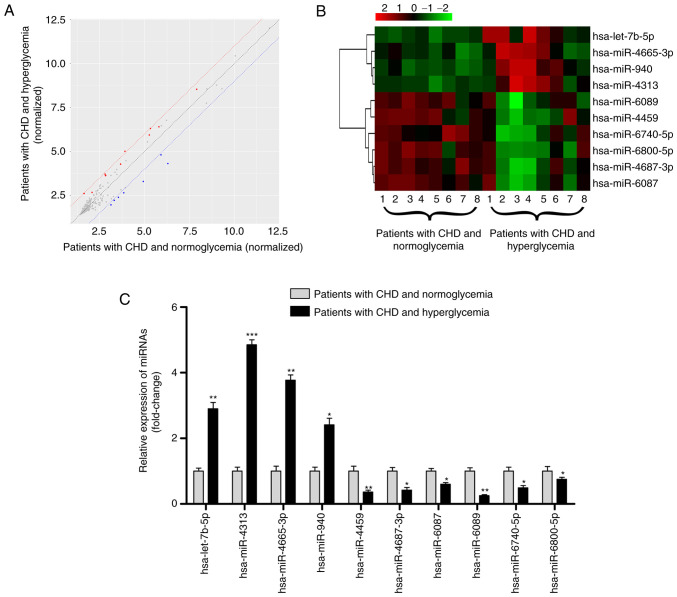
Figure 2.
Profile of exosomal miRNAs in the serum of patients with CHD and hyperglycemia. (A) Scatter plot showing the expression profile of exosomal miRNAs between eight patients with hyperglycemia and eight patients with normoglycemia; miRNAs above and below the border lines (red and blue) exhibited a >2 fold-change difference in expression. (B) Clustered heatmap for the 10 DEMIs, including hsa-let-7b-5p, hsa-miR-4313, hsa-miR-4665-3p, hsa-miR-940, hsa-miR-4459, hsa-miR-4687-3p, hsa-miR-6087, hsa-miR-6089, hsa-miR-6740-5p and hsa-miR-6800-5p. (C) Reverse transcription-quantitative PCR validation of the 10 DEMIs in 75 patients with CHD and hyperglycemia and 75 patients with CHD and normoglycemia. Data are expressed as the mean ± standard deviation. *P<0.05, **P<0.01, ***P<0.001 vs. patients with CHD and normoglycemia. CHD, coronary heart disease; DEMIs, differentially expressed miRNAs; miRNA/miR, microRNA.

