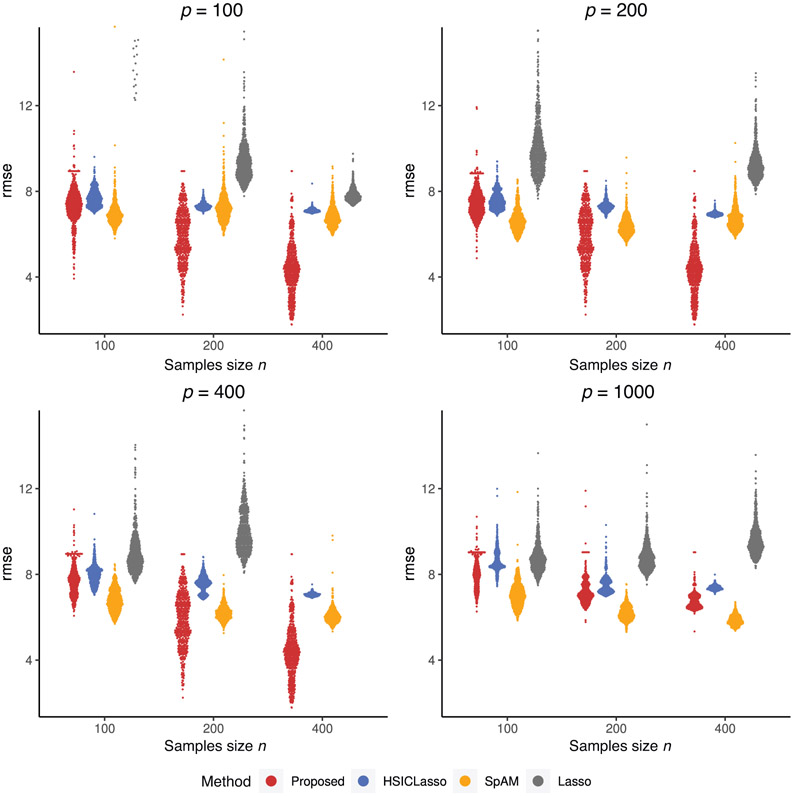
FIGURE 1. Violin plots of prediction errors for continuous outcome.
Note: The plots give the distribution of prediction errors among four competing methods. The comparing methods from left to right in each plot are our proposed method, HSICLasso, SpAM, and Lasso. This figure appears in color in the electronic version of this article, and any mention of color refers to that version

