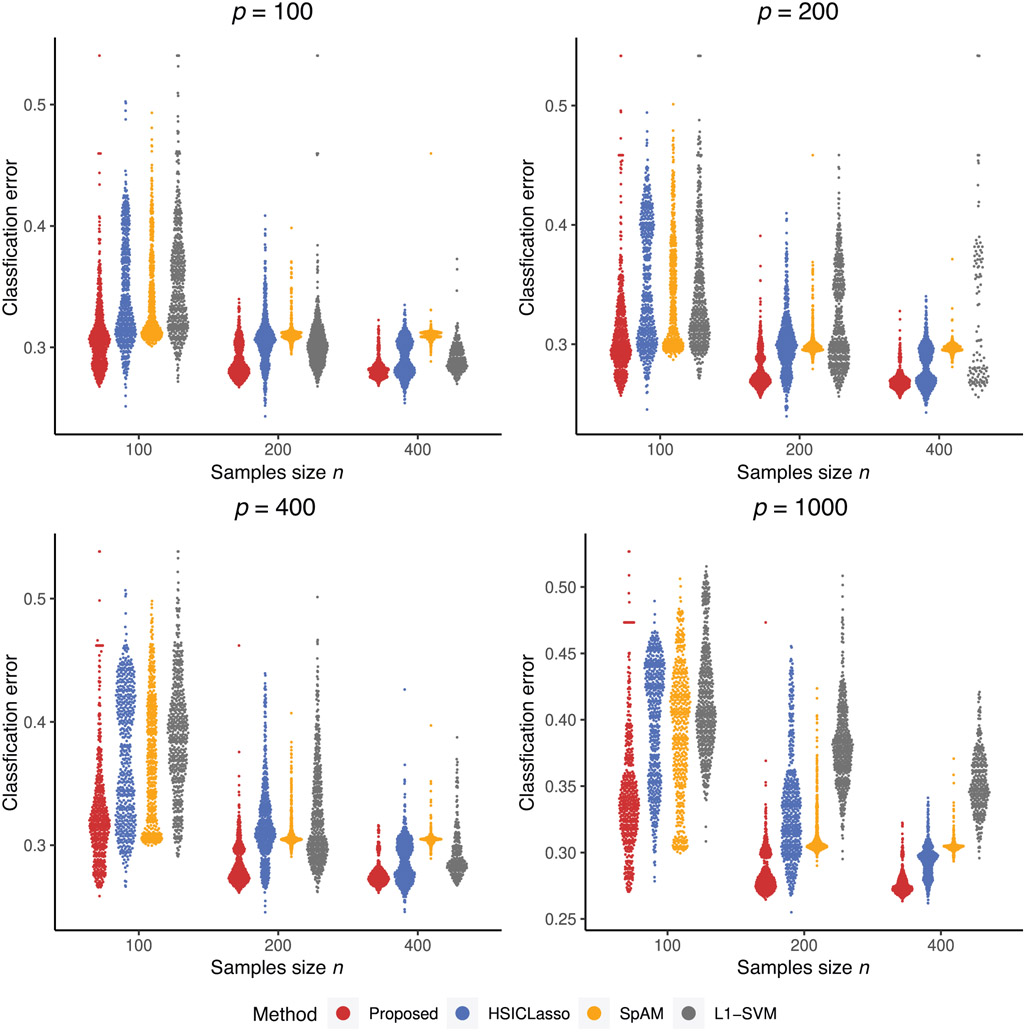
FIGURE 2. Violin plots of misclassification errors for binary outcome.
Note: The plots give the distribution of misclassification rates among four competing methods. The comparing methods from left to right in each plot are our proposed method, HSICLasso, SpAM, and -SVM. This figure appears in color in the electronic version of this article, and any mention of color refers to that version

