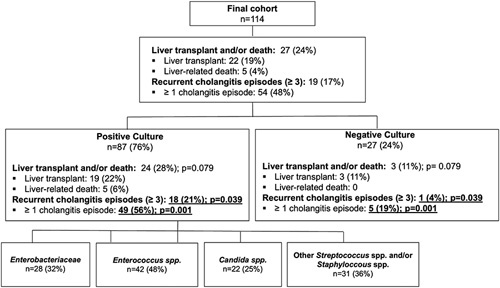
FIGURE 1.

Flowchart with overview of outcome parameters of the total cohort and subcohorts. The p-values are based on the Pearson χ² test. Significant results (p < 0.05) are underlined and shown in bold type. Abbreviation: spp., species.

Flowchart with overview of outcome parameters of the total cohort and subcohorts. The p-values are based on the Pearson χ² test. Significant results (p < 0.05) are underlined and shown in bold type. Abbreviation: spp., species.