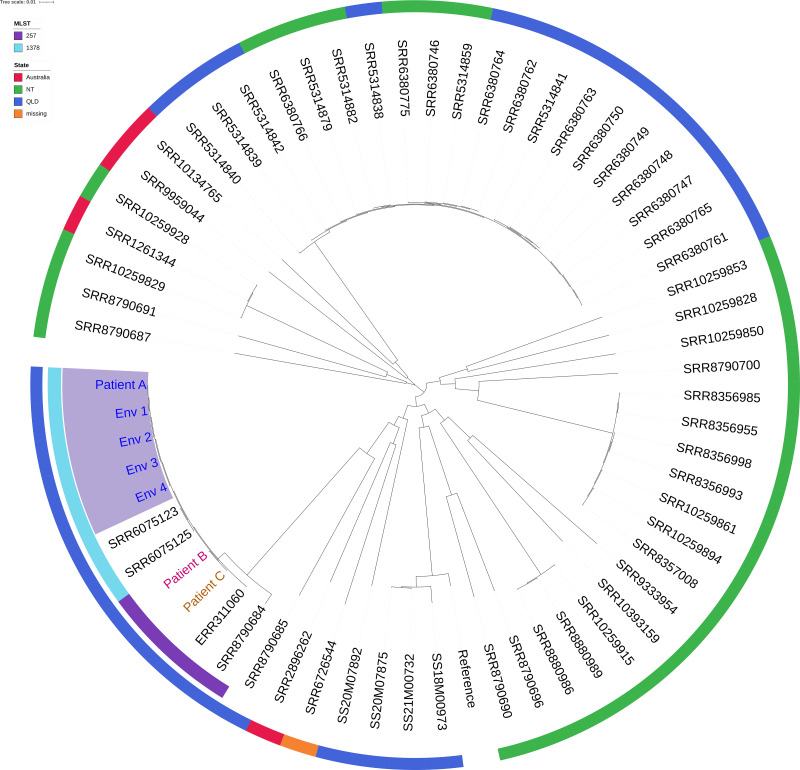
Figure 2.
Phylogenetic Maximum Likelihood Tree built using SNP differences between isolates. The inner ring represents the MLST ST and the outer ring indicates geographic location of isolation. The cluster containing Patient A and corresponding soil isolates is highlighted. The length of branches represents distance between groups as indicated by the scale bar.

