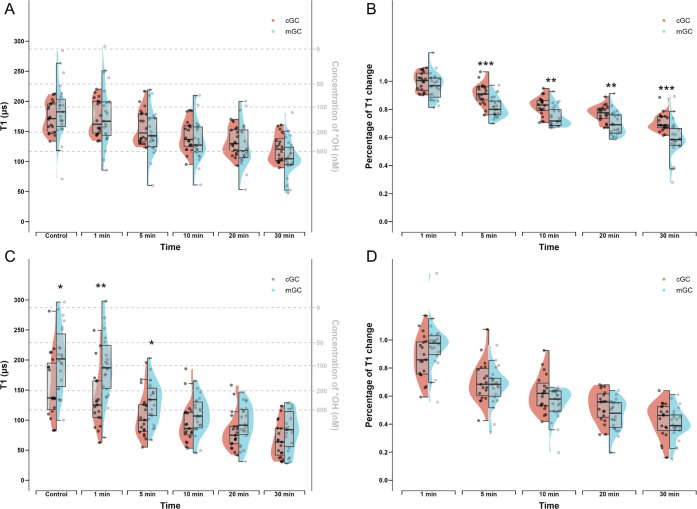
Figure 7.
Half-violin plots showing differences between cGCs and mGC free radical levels and changes in response to menadione at different time points. (A) T1 values measured by all the bare-FNDs in cGCs and mGCs were compared to show the differences between cGC and mGC absolute cytoplasm free radical levels at 0, 1, 5, 10, 20, 30 min after menadione treatment. (B) Percentages of T1 changes measured by all the bare-FNDs in cGCs and mGCs were compared to show the differences between cGC and mGC cytoplasm free radical changes at 1, 5, 10, 20, 30 min when compared to the control. (C) T1 measured by all the aVDAC2-FNDs in cGCs and mGCs were compared to show the differences between cGC and mGC absolute mitochondrial free radical levels at 0, 1, 5, 10, 20, 30 min after menadione treatment. (D) Percentages of T1 changes measured by all the aVDAC2-FNDs in cGCs and mGCs were compared to show the differences between cGC and mGC mitochondrial free radical changes at 1, 5, 10, 20, 30 min when compared to the control. Significance was tested by using a t test. * p < 0.5, ** p < 0.01, *** p < 0.001, **** p < 0.0001.

