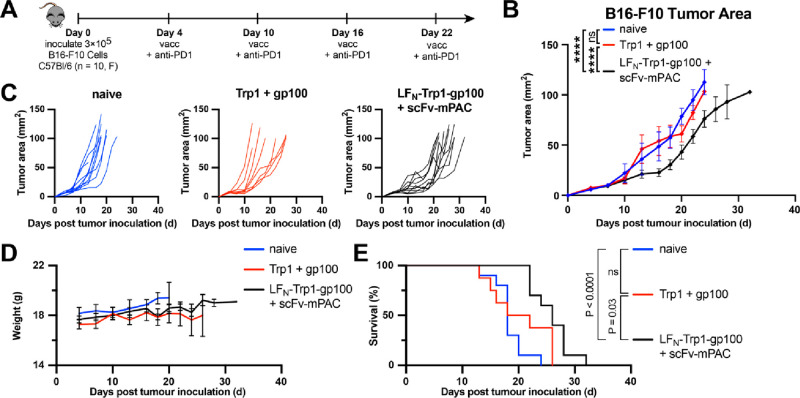
Figure 7.
Vaccine efficacy for cancer immunotherapy. (A) Immunization timeline. Mice (F, C57Bl/6, n = 10 per group) were s.c. inoculated with 3 × 10⁵ B16–F10 cells (day 0). On days 4, 10, 16, and 22, all mice were intraperitoneally (i.p.) injected with anti-PD1 antibody (200 μg) and were s.c. vaccinated (vacc) with c-di-GMP (25 μg) combined with either Trp1 + gp100 peptides (50 pmol each) or LFN-Trp1-gp100 (50 pmol) + scFv-mPAC (10 pmol). (B) Mean tumor growth (mm2) per group. Data represent the mean tumor growth ± SEM. Statistical significance was calculated using two-way ANOVA with Tukey test (main effect only model) with multiple mean comparisons on the entire curves, * P < 0.05; ** P < 0.005; *** P < 0.001; and **** P < 0.0001. (C) Tumor growth plots for the individual mice over the entire experiment. (D) Body weight. Data represent the mean + SEM (E) Kaplan–Meier percent of survival curves. Statistical significance was calculated using the log-rank Mantel–Cox test. Median survival: 18 days in the naïve group, 20 days in the Trp1 + gp100 group, and 26 days in the LFN-Trp1-gp100 + scFv-mPAC group.

