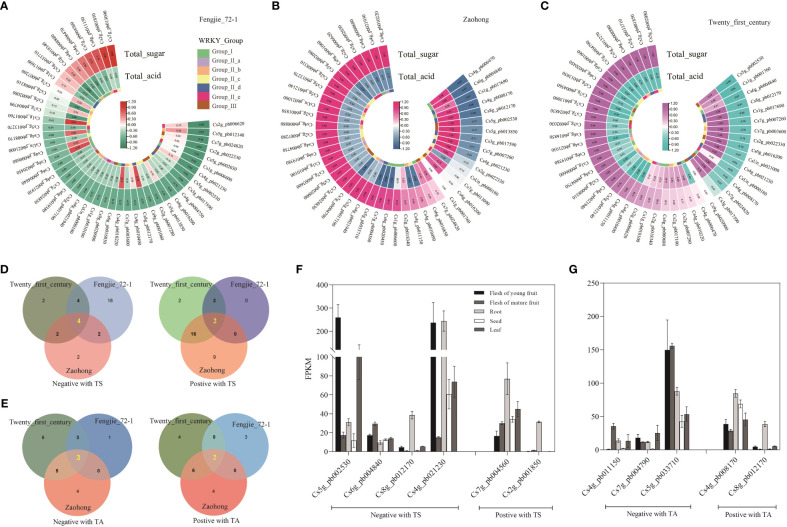
Figure 5.
Correlation analysis of CsWRKYs with sugars and organic acids in citrus fruit. Heatmap of Pearson’s correlation coefficients between CsWRKYs and sugar and acid contents in the pulp of ‘Fengjie 72-1’ (A), ‘Zaohong’ (B), and ‘Twenty-first century’ (C) orange fruits. Venn diagrams of CsWRKYs co-expressing with the content of total sugar (D) and total organic acid (E) (correlation coefficient >0.6 or <−0.6). The expression profile of co-expressing CsWRKYs in different tissues of orange fruit (F, G).

