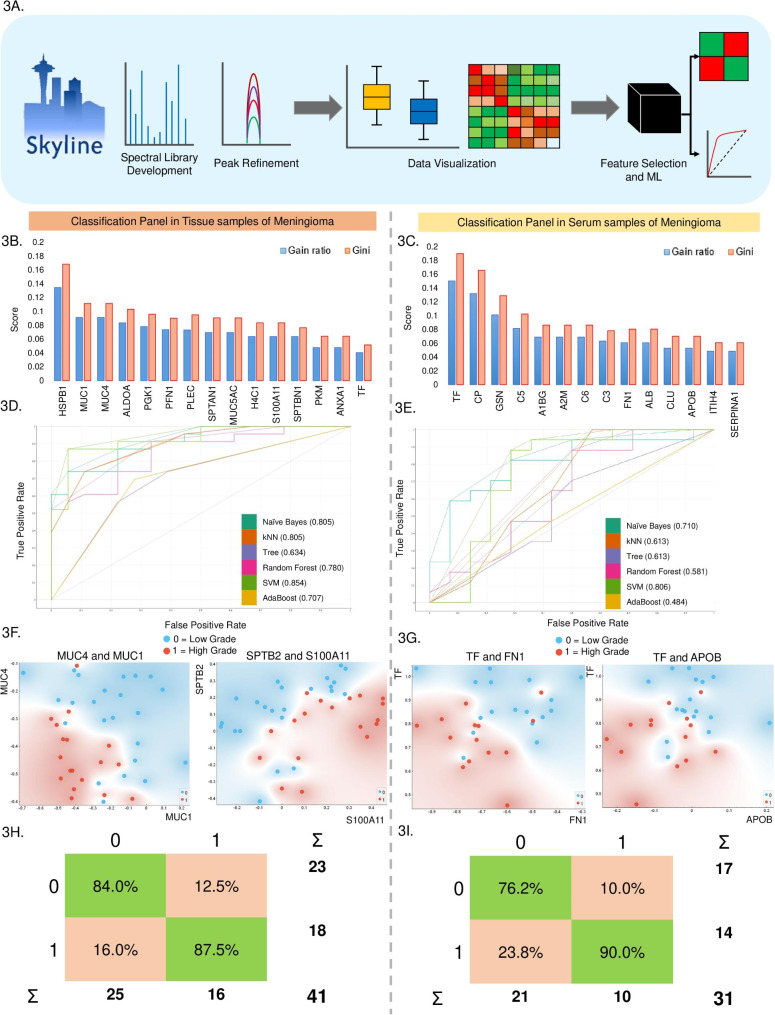
Fig. 3.
Classification and Segregation potential of selected features using Machine Learning. (3A) Schematic outline of Machine Learning and Data analysis workflow. (3B and C) illustrates the top-ranked features using Gini and Gain ratio in regards to Low Grade and High-Grade segregation in tissue and Serum samples, (3D and E) Model optimization for serum samples using ROC Curve for Tissue and Serum markers; (3F) shows the clustering plot for the combination of MUC4 and MUC1 followed by SPTB2 and S100A11; (3G) shows the clustering plot for the combination of TF and FN1 followed by TF and APOB; (3H and I) represent the confusion matrix using top features for tissue and serum respectively

