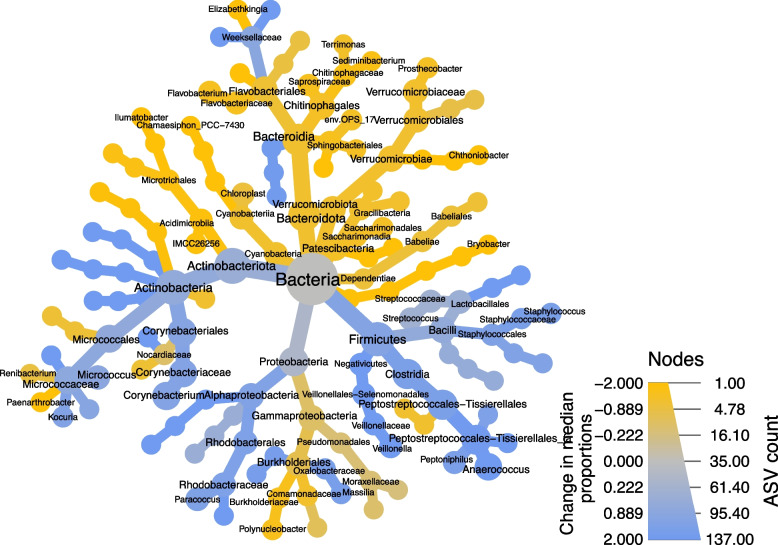
Fig. 3.
Significant differences in ASV abundance across the epidermis was analysed using mixed linear modelling (AD patients and healthy participants visualised together). A heat tree was constructed from the 238 ASVs that were found to significantly vary between tapes, with node size representing the total number of ASVs (q-value > 0.05) and node colour representing the change in ASV abundance (log2) between the swabs (higher relative abundance in swabs represented by blue coloration) and the tape-35 samples (higher relative abundance in tape 35 represented by green coloration)

