Fig. 3.
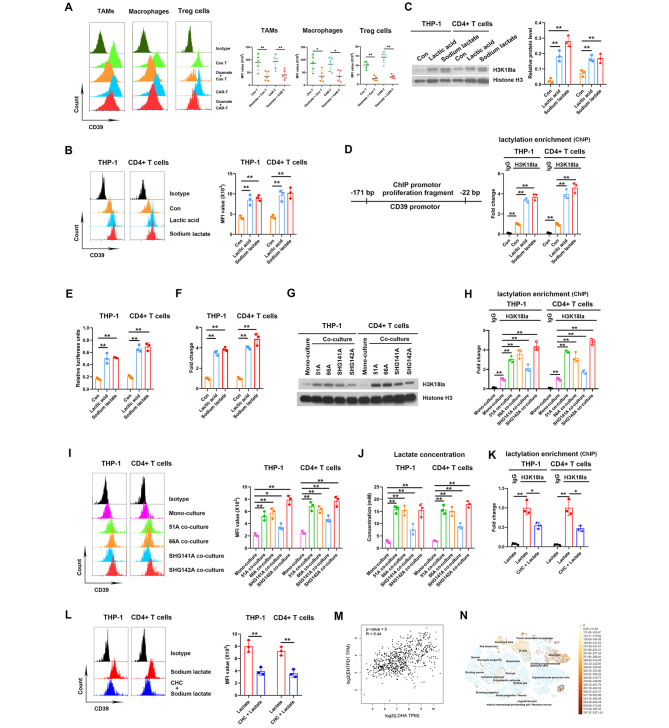
Lactate in the TME increased CD39 level by inducing H3K18la on gene promoter. (A) CD39 levels in TAMs, macrophages and Treg cells within tumor tissues from 51 A GSCs implanted nude mice. The gating strategies of TAMs and macrophages in Fig. 2A and Treg cells in Fig. 1C were showed. N = 5. (B-F) Macrophages from differentiated THP-1 cells and CD4 + T lymphocytes isolated from PBMCs were treated with PBS, 10 mM lactic acid or sodium lactate for 24 h. (B) CD39 protein level was detected using flow cytometry. (C) Histone H3K18la level was detected using western blot. (D) ChIP assay was performed using anti-H3K18la antibody, and the enrichment of CD39 gene promotor was qualified by qPCR. (E) Lymphocytes were transfected with pGL3 plasmid carrying CD39 promotor sequence, luciferase units were detected after lactic acid or sodium lactate treatment. (F) CD39 mRNA expression was detected using RT-qPCR. (G-J) THP-1 and CD4 + T cells were mono-cultured or co-cultured with GSCs for 12 h, H3K18la levels (G), H3K18la enrichment on CD39 promoter region (H) and CD39 protein level (I) in THP-1 and T cells and lactate concentration in medium (J) were detected. (K, L) THP-1 and CD4 + T cells were treated with sodium lactate for 24 h in pretreatment with 3 mM CHC for 2 h or not, H3K18la enrichment on CD39 promoter region using ChIP assay (K) and CD39 protein level (L) were detected. (M) The correlation of LDHA and ENTPD1, coding CD39 protein, expressions in TCGA database. (N) CD39 expression in GBM patients using single-cell RNA-seq on the UCSC Cell Browser. *P < 0.05, **P < 0.01

