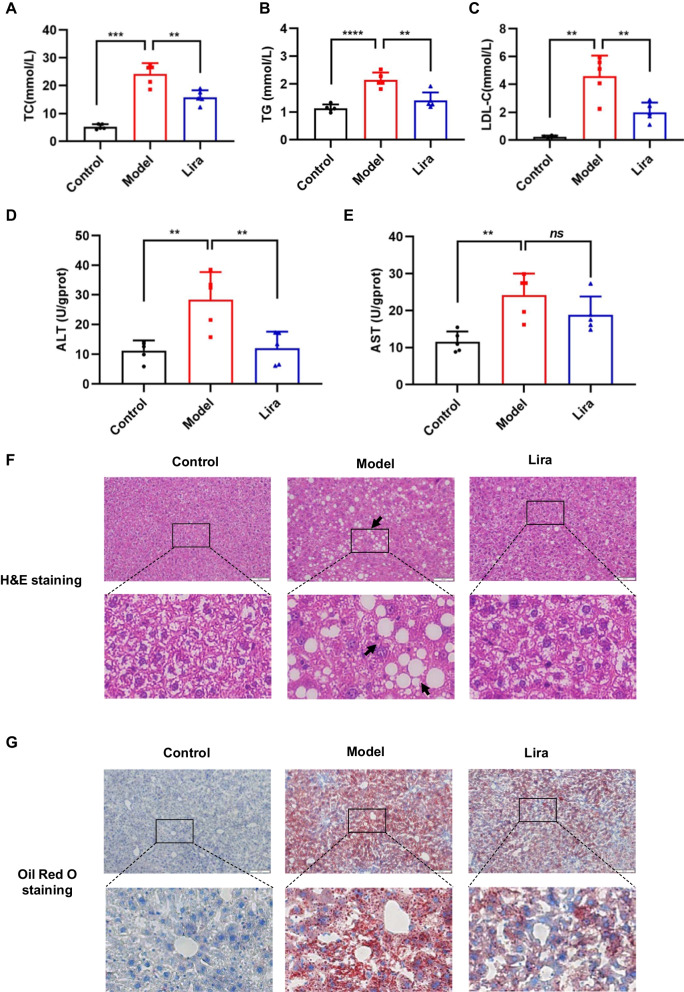
Fig. 2.
The effects of liraglutide on liver histology, liver injury and lipid accumulation of T2DM mice. The serum levels of TC (A), TG (B) and LDL-C (C) in different groups. The serum levels of ALT (D) and AST (E) were measured. F Representative images of H&E staining of liver (scale bar, 100 μm). G Representative images of Oil Red O staining of liver (scale bar, 100 μm). Data are expressed as mean ± SD. n = 5. *P < 0.05, **P < 0.01, ***P < 0.001, ****P < 0.0001, ns means no significant difference

