Fig. 3.
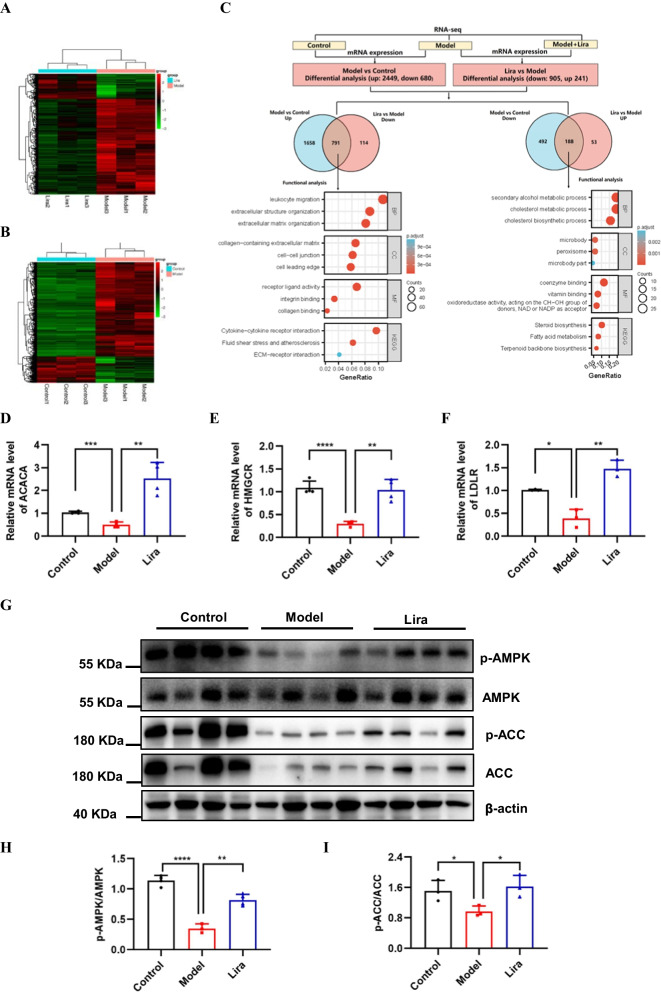
Liraglutide regulates lipid metabolism. A Heatmap shows differential expressed genes in hepatic tissue between control and model mice. Low expression is depicted in green, and high expression is depicted in red (n = 3). B Heatmap shows differential expressed genes in hepatic tissue between model and liraglutide mice. Low expression is depicted in green, and high expression is depicted in red (n = 3). C Gene ontology (GO) and Kyoto Encyclopedia of Genes and Genomes (KEGG) enrichment analyses the overlap genes, which are overlapped between upregulated 2449 genes (Model vs Control) and downregulated 905 genes (Lira vs Model), between downregulated 680 genes (Model vs Control) and upregulated 241 genes (Lira vs Model). D–F ACACA (n = 4), HMGCR (n = 4) and LDLR (n = 3) mRNA levels in three group mice were analyzed by RT-PCR. G Phosphorylated AMPK levels and phosphorylated ACC protein levels in the three group mice were analyzed by Western blotting (n = 4). H–I Quantification of G. Data are expressed as mean ± SD. *P < 0.05, **P < 0.01, ***P < 0.001, ****P < 0.0001

