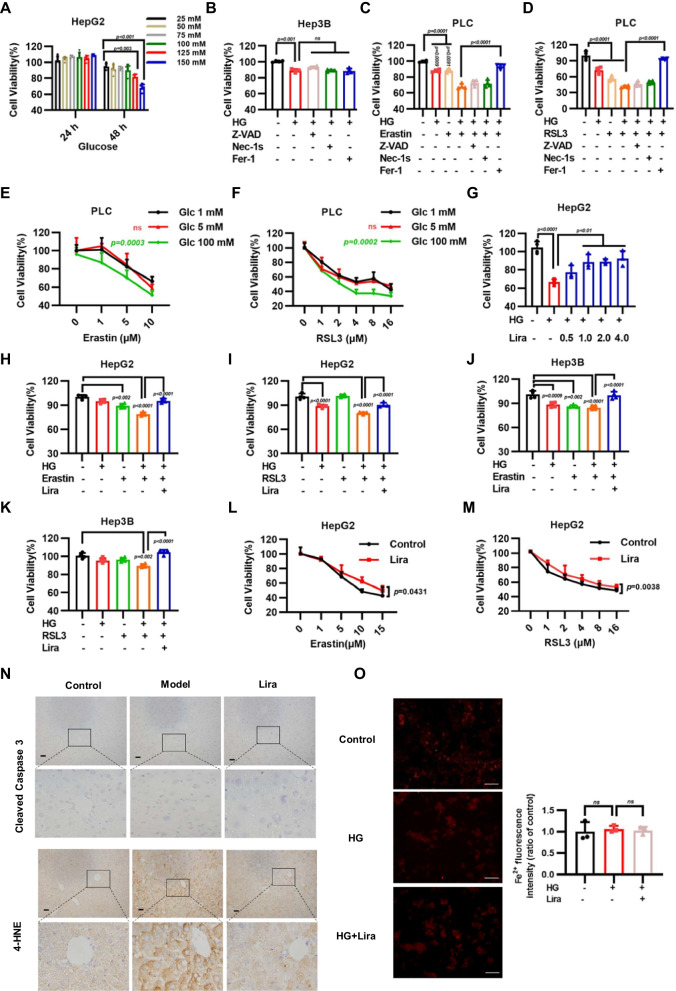
Fig. 4.
Liraglutide inhibits sensitivity of high glucose on ferroptosis. A Cell viability in HepG2 cells treated with indicated concentrations of high glucose (HG) for 24 h and 48 h. B Cell viability in Hep3B cells treated with HG (125 mM, 48 h) and combined with 5 µM Z-VAD-FMK (Z-VAD, 24 h), 2 µM Necrostatin-1 s (Nec-1 s, 24 h) and 5 µM ferrostatin-1 (Fer-1, 24 h). Bar graphs showing cell viability in indicated cells treated with HG (125 mM, 48 h) or erastin (10 µM, 24 h) (C), RSL3 (1.0 µM, 24 h) D and combined with 5 µM Z-VAD-FMK (Z-VAD, 24 h), 2 µM Necrostatin-1 s (Nec-1 s, 24 h) and 5 µM ferrostatin-1 (Fer-1, 24 h). PLC cells viability were measured with 1 mM, 5 mM, 100 mM glucose (48 h) combined with erastin (24 h) E or RSL3 (24 h) (F). G Cell viability measured in HepG2 cells treated with 125 mM HG and different concentrations of liraglutide for 48 h. H–I HepG2 and Hep3B cells were treated with 100 mM HG, erastin (5 μM) and combined with 1.0 μM liraglutide for 24 h. J, K HepG2 and Hep3B cells were treated with 100 mM HG, RSL3 (0.5 μM) and combined with 1.0 μM liragluide for 24 h. Cell viability was determined by CCK-8 assays. L Cell viability measured in HepG2 cells treated with different concentrations of erastin (24 h) combined with 2.0 μM liraglutide (48 h). M Cell viability measured in HepG2 cells treated with different concentrations of RSL3 (24 h) combined with 2.0 μM liraglutide (48 h). N Representative images from immunohistochemical staining of liver tissue microarray for Cleaved caspase-3 and 4-HNE (scale bar, 50 μm). O Representative Fe2+ fluorescence images of HepG2 cell (scale bar, 100 μm) Data are expressed as mean ± SD, n = 4

