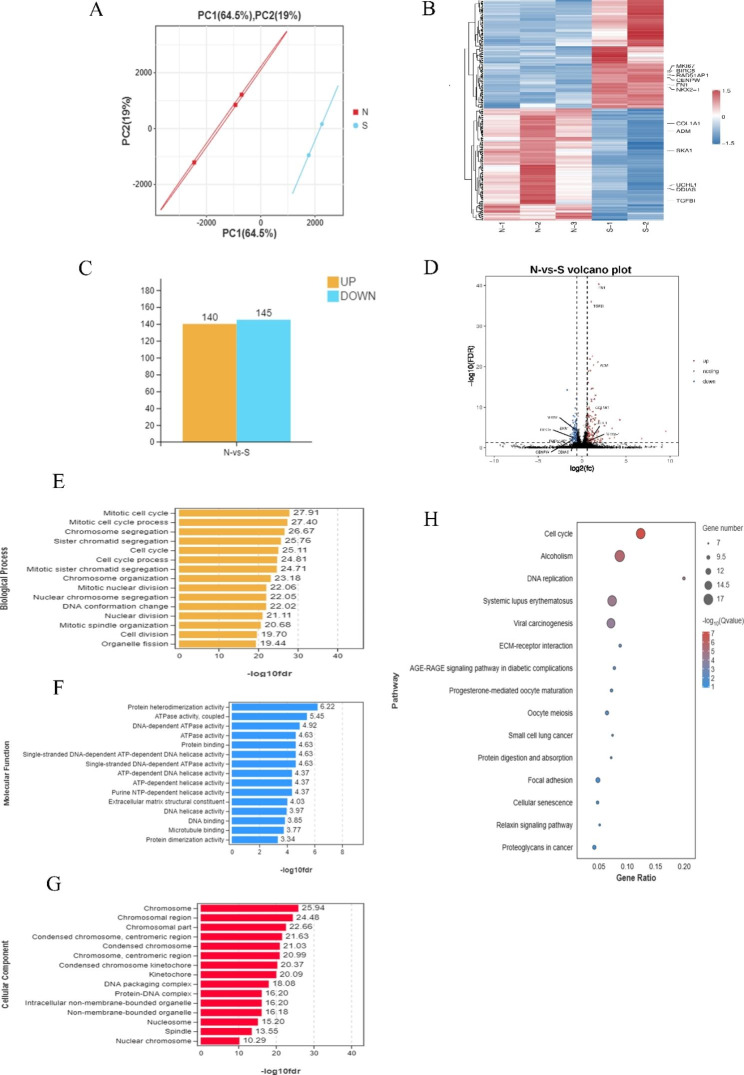
Fig. 4.
The overall transcriptomes characteristics between the control and stretch groups. (a) The PCA plot of transcriptome profiling. (b) Heat maps of mRNA (|log2FC| >0.58 and FDR < 0.05). Red and blue indicate up- and downregulation, respectively. (c) Histogram of differentially expressed genes (DEGs) expression between the control and stretch groups. (d) The volcano analysis of DEGs with color-coded. The x-axis represented the log2 of fold change (FC) and the y-axis represented log10 of p values. Blue dots were downregulated genes and red dots were upregulated genes. The leftover black dots were the genes without significant differences. The top 15 enrichment GO of differentially expressed genes. All GO terms were divided into three ontologies: yellow, biological process (e); blue, molecular function (f), and red, cellular component (g). The top 15 KEGG pathway terms (h) of differentially expressed genes

