Fig. 5.
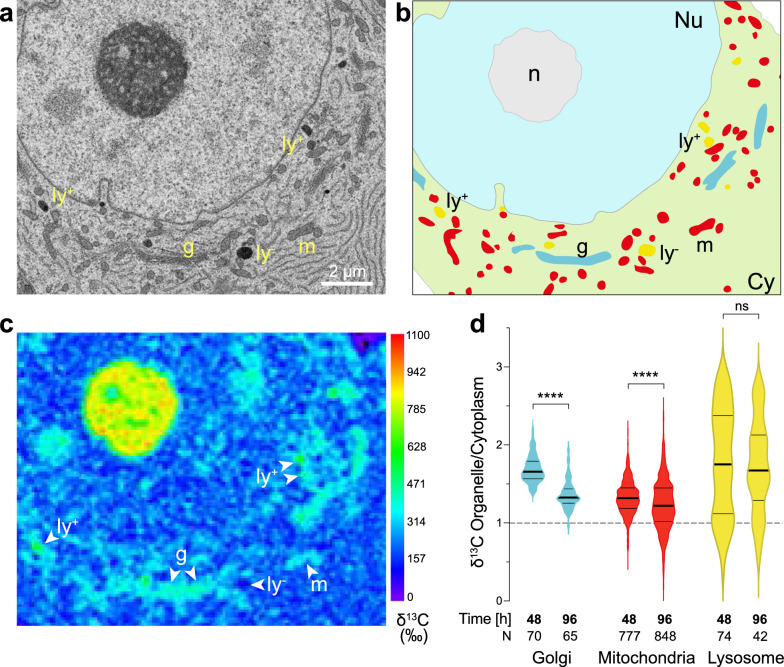
NanoSIMS analysis of 13C enrichment in specific organelles within the cell body of nigral neurons (control hemisphere). a Representative SEM image of a large neuronal cell body located in the SNpc allowed to identify three types of organelles, the mitochondria (m), the Golgi apparatus (g) and lysosomes (ly). b SEM-based segmentation of compartments and organelles in the cell body; Cy: cytoplasm; Nu: nucleus; n: nucleolus. c Corresponding map of 13C enrichment. Note the presence of both 13C-rich lysosomes (ly+) and 13C-poor lysosomes (ly−) within the same neuronal cell body. d 13C enrichment in Golgi, mitochondria and lysosomes, as compared to the cytoplasm, measured at the end of the pulse with 13C-labeled glucose (48 h time point) and after the chase period (96 h time point). Note the significant decrease in 13C enrichment in the Golgi and mitochondria. In contrast, 13C enrichment in lysosomes is highly variable and does not significantly decrease over the chase period. The thick lines in the violin plots represent the median and the thin lines the upper and lower quartiles. The number of organelles analyzed is indicated at the bottom of the histogram bar. 48 h: N = 11 neurons from 2 rats; 96 h: N = 12 neurons from 3 rats. Statistical analysis: Mann–Whitney two-tailed test; ns = not significant; ****P < 0.0001. Scale bar: 2 µm

