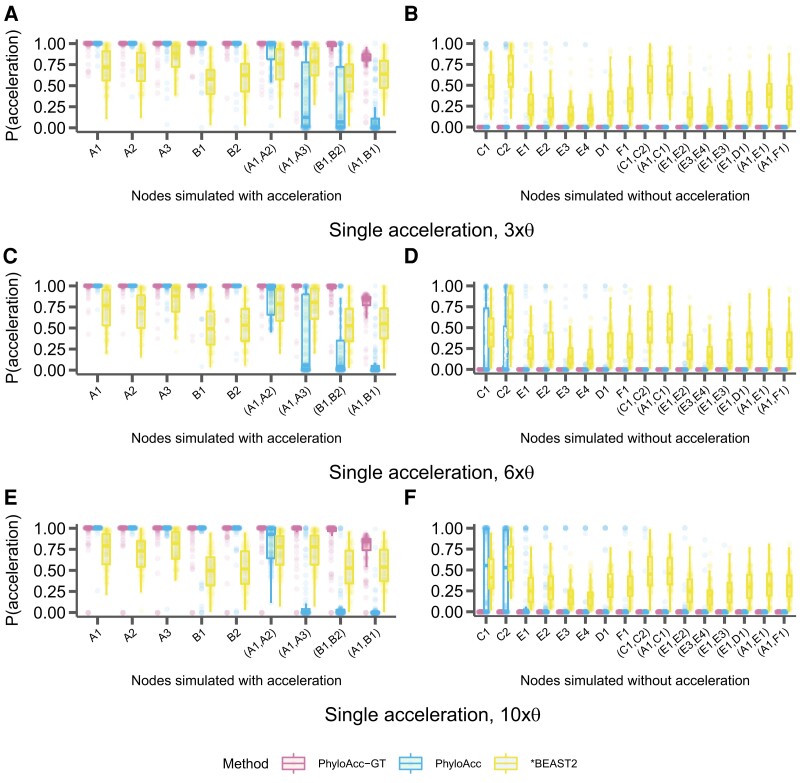
Fig. 10.
Distributions of the probability of being in the accelerated state [] using PhyloAcc-GT (leftmost boxplot for each branch), PhyloAcc (middle boxplot for each branch), and *BEAST2 (rightmost boxplot for each branch) while scaling the population size parameter, . Distributions shown for data simulated with a single acceleration in the A and B clades (fig. 2B). Branches are indicated on the x-axis of each panel and correspond to those in figure 2A. Distributions on the left correspond to lineages simulated to have accelerated sequence evolution while the distributions on the right correspond to lineages simulated without accelerated sequence evolution. (A & B) Sequences simulated with 3 times the expected . (C & D) Sequences simulated with 6 times the expected . (E & F) Sequences simulated with 10 times the expected .

