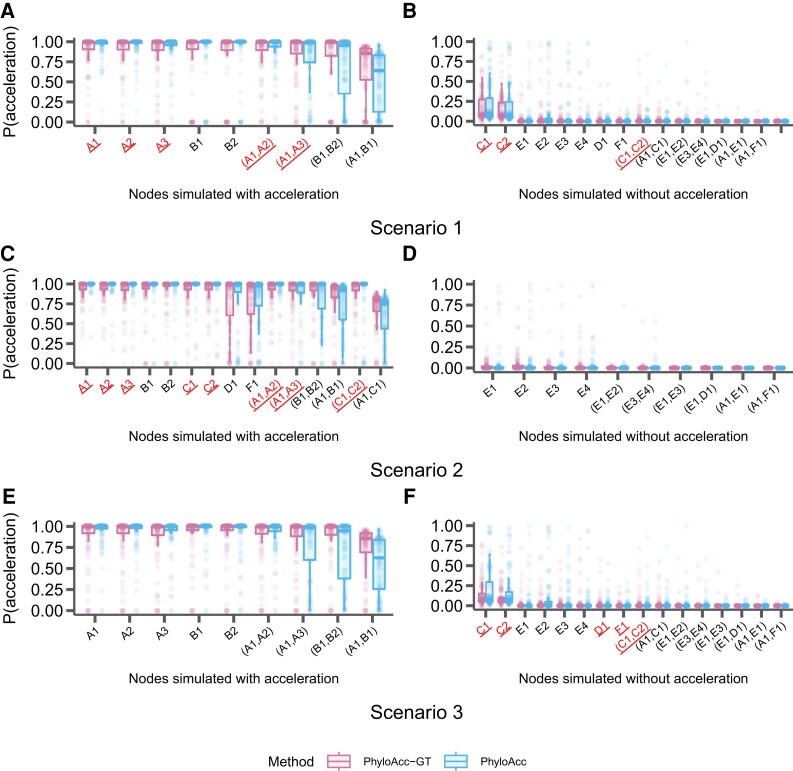
Fig. 6.
Distributions of the probability of being in the accelerated state [] for each branch in the input species tree when specified target lineages are mis-specified. Branches are indicated on the x-axis of each panel and correspond to those in figure 2A. Distributions on the left correspond to lineages simulated to have accelerated sequence evolution in each of the three scenarios in figure 2, and distributions on the right correspond to those without accelerated sequence evolution. Branches underlined on the x-axis are those that were specified as target lineages for M1 in each run of PhyloAcc or PhyloAcc-GT and the three scenarios correspond to those outlined in figure 5. Each point represents one simulated locus. (A & B) The probability of being in the accelerated state using sequences simulated with a single monophyletic acceleration (fig. 2B) and targets specified that partially overlap lineages that are truly in the accelerated state. (C & D) The probability of being in the accelerated state using sequences simulated with two independent accelerations (fig. 2C) and targets specified as a subset of lineages that are truly in the accelerated state. (E & F) The probability of being in the accelerated state using sequences simulated with three independent accelerations (fig. 2D), and no lineages that are truly in the accelerated state being specified as targets.

