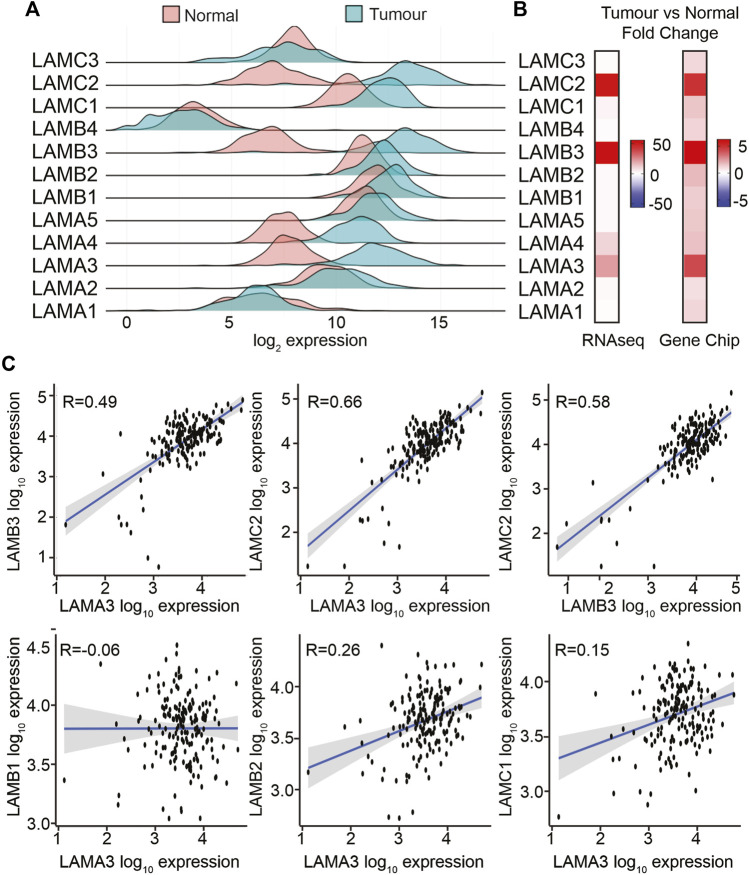
FIGURE 2.
LAMA3, LAMB3, and LAMC2 mRNA expression levels are increased in PAAD. (A) Comparison of transcript levels of LM family members in normal (n = 252) and tumour tissues (n = 177) from RNA-seq TCGA data. Expression was normalised, and counted mean expression is shown as log2 fold changes. (B) Heatmaps comparing the mean fold difference between normal and PAAD tumour samples in RNA-seq (left) or gene chip (right) datasets. (C) Expression correlation between LAMA3 with LAMB3, LAMC2, LAMB1, LAMB2, and LAMC1, and LAMB3 with LAMC2.

