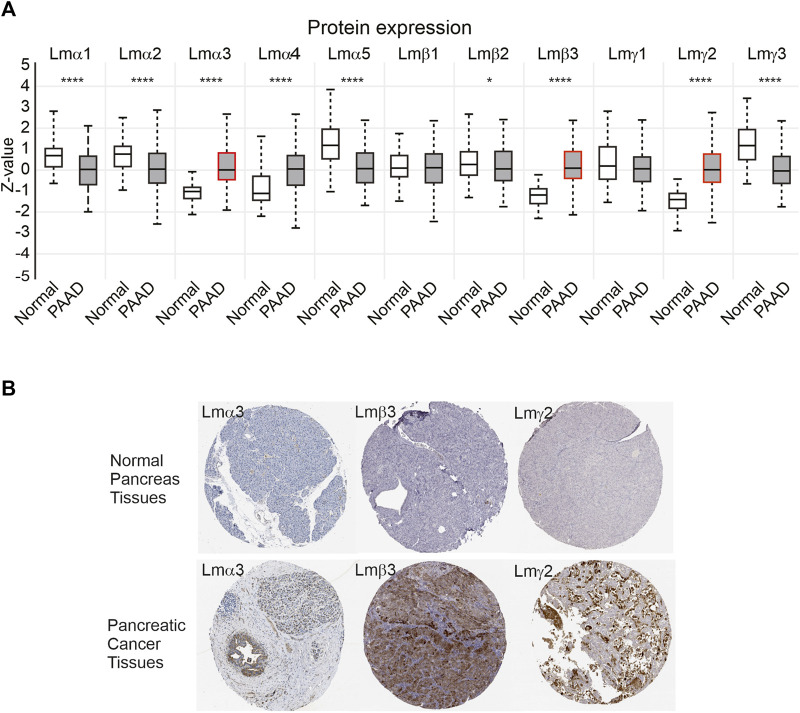
FIGURE 3.
LM α3, β3, and γ2 protein levels are increased in PAAD samples. (A) Z-score comparison of normal (n = 74) and primary PAAD tumours (n = 137) from the CPTAC dataset, for each LM chain. Boxes represent 25th–75th percentile whisker to maximum and minimum and, line at median. Red outlines highlight LMα3, LMβ3, and LMγ2. Differences between normal and PAAD samples reach statistical significance at p < 0.001 for LMα1, LMα2, LMα3, LMα4, LMα5, LMβ3, LMγ2, and LMγ3. *p < 0.05, **p < 0.01, ***p < 0.001, and ****p < 0.0001. (B) Representative immunohistochemistry images of anti-LMα3, LMβ3, or LMγ2 in normal and pancreatic cancer specimens from the Human Protein Atlas (https://www.proteinatlas.org).

