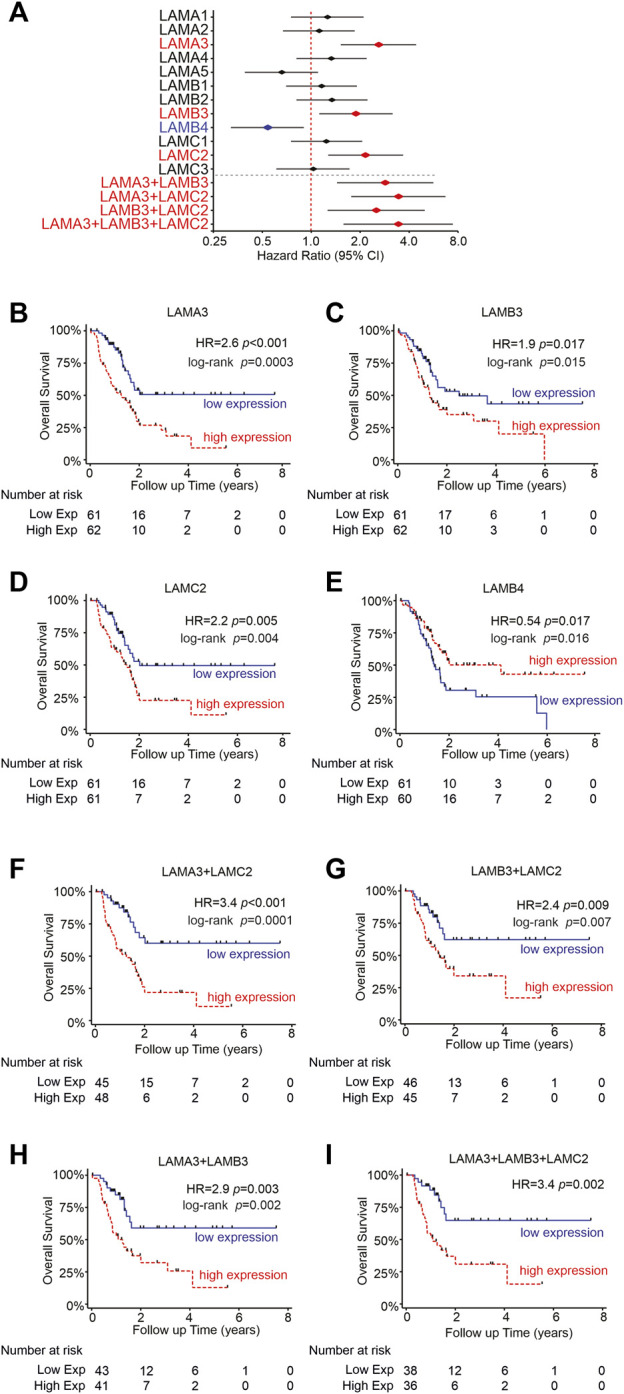
FIGURE 5.

High LM332 gene expression predicts poor patient survival rates in PAAD. (A) Forest plot of hazard ratios (diamond) with 95% confidence intervals for overall survival, comparing the upper third RNA expression level of each gene or gene combinations in PAAD patients versus the lower third expression levels. Positive numbers indicate worse survival rates in the high-expression group. Red text and symbols or blue text and symbols indicate statistically significant (p < 0.05) worse outcomes for high- or low-expression groups, respectively. (B–E) Kaplan–Meier plots for individual genes, comparing upper and lower terciles and (F–I) Kaplan–Meier plots for indicated pairs/triplet of genes. HR = hazard ratio with p-values calculated using Cox regression.
