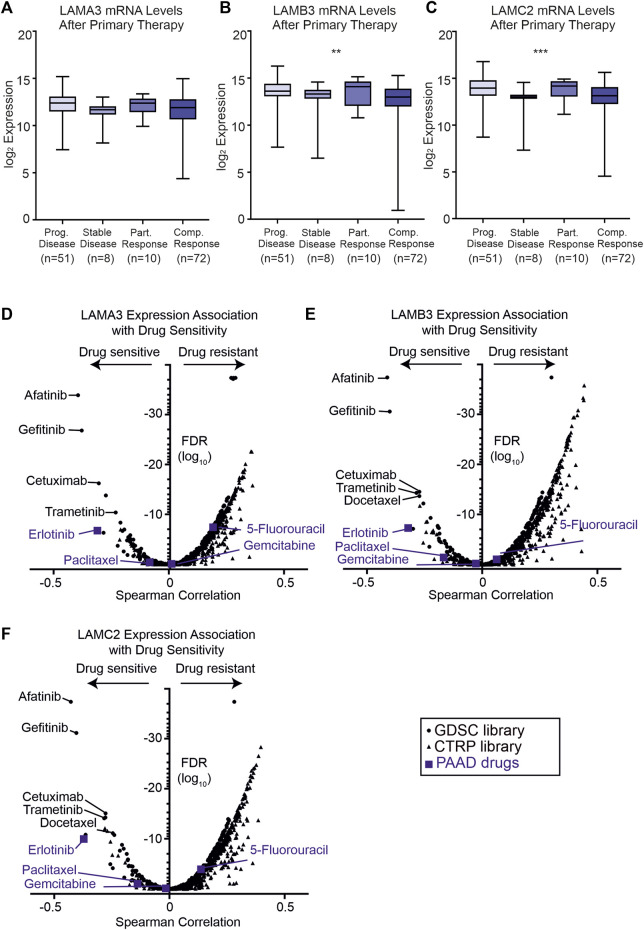
FIGURE 9.
High LAMA3, LAMB3, and LAMC2 expression are related to primary therapy and sensitivity to EGFR inhibitors. (A–C) Z scores of protein levels of LMα3 (A), LMβ3 (B), and LMγ2 (C) in samples after primary therapy then segregated based on clinical outcome into either progressive disease, stable disease, partially response or complete response, *p < 0.05, **p < 0.01, ***p < 0.001, and ****p< 0.0001. (D–F) Volcano plots of Spearman correlation coefficients between LAMA3 (D), LAMB3 (E), LAMC2 (F) and sensitivity to the tested compound plotted against the false discovery rates (FDR). Data were generated from drug sensitivity screens in cancer lines as a combination of Genomics of Drug Sensitivity in Cancer (GDSC, squares) and the Therapeutics Response Portal (CTRP, triangles) screens, accessed using the GSCA platform. Commonly used pancreatic adenocarcinoma therapeutics are coloured blue.

