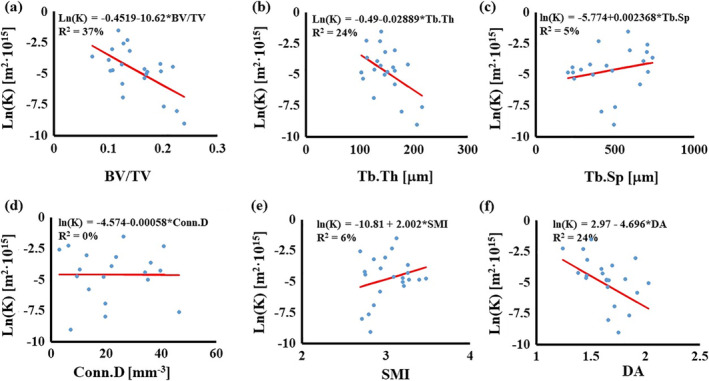
Figure 2.

Simple linear regressions for K with morphological parameters: (A) relationship with BV/TV; (B) relationship with Tb.Th; (C) relationship with Tb.Sp; (D) relationship with Conn.D; (E) relationship with SMI; and (F) relationship with DA. In the figures, circles are the experimental points; the continuous line represents the regression model. BV/TV = bone volume over total volume; Conn.D = connectivity density; DA = degree of anisotropy; SMI = structure model index; Tb.Sp = trabecular spacing; Tb.Th = trabecular thickness.
