FIGURE 2.
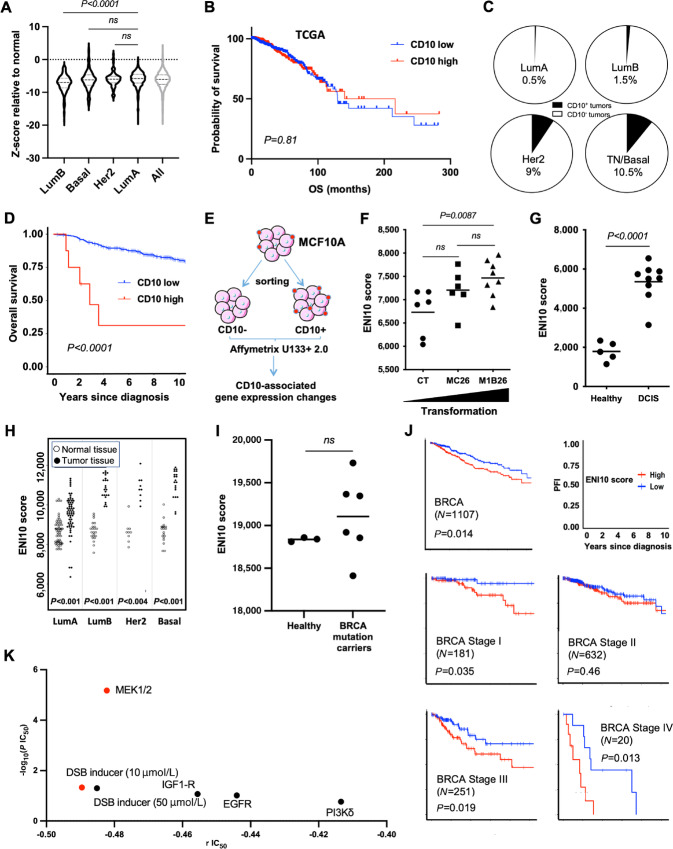
The molecular identity of untransformed CD10-positive cells increase with mammary gland transformation. A, CD10 transcript expression in TCGA breast tumors according to the molecular classification compared with normal samples. B, Kaplan–Meier plot of patients with breast cancers in TCGA cohort as a function of CD10 expression level. C, Quantification in a TMA of the percentage of tumors with CD10 IHC staining higher than 20% according to tumor subtype. D, Kaplan–Meier plot of patients with breast cancers from the TMA (as in C) as a function of CD10 protein expression level. E, Schematic representation of the experimental protocol used to obtain identify the ENI10 molecular signature. F, ssGSEA quantification of the CD10 signature score in the different MCF10A-derived cell lines with nontransformed (CT, n = 6), early (MC26, n = 6) and more aggressive (M1B26, n = 8) transformed models. G, ssGSEA ENI10 score of human primary DCIS versus healthy mammary gland (series GSE21422). H, ssGSEA ENI10 score of matched normal or tumoral breast tissue from breast cancer subtypes from TCGA's Pan-Cancer Atlas. I, ssGSEA ENI10 score from RNA-seq transcriptomic data from three normal breast epithelial cells samples (wildtype) and six BRCA mutated healthy epithelial cells samples. J, Kaplan–Meier plots of patients with breast cancers in TCGA cohort as a function of cancer stage and ENI10 score. K, Using transcriptomic data from the “Genomics of drug sensitivity in cancer” project from the Sanger Institute, ENI10 score of human breast cancers cell lines were correlated with their IC50 to 441 drugs. Drugs showing a significative negative correlation between the ENI10 ssGSEA score and IC50 (indicating a sensitivity to the drug when the ENI10 score increase) are shown. According to the GDSC guidelines, red dots show drugs with a significative IC50 correlation with the ENI10 score with a P value inferior to 0.001 and a Benjamini–Hochberg FDR inferior to 0.25. Black dots show suggestive correlations with a P value inferior to 0.005 and a nonparametric P value inferior to 0.1.

