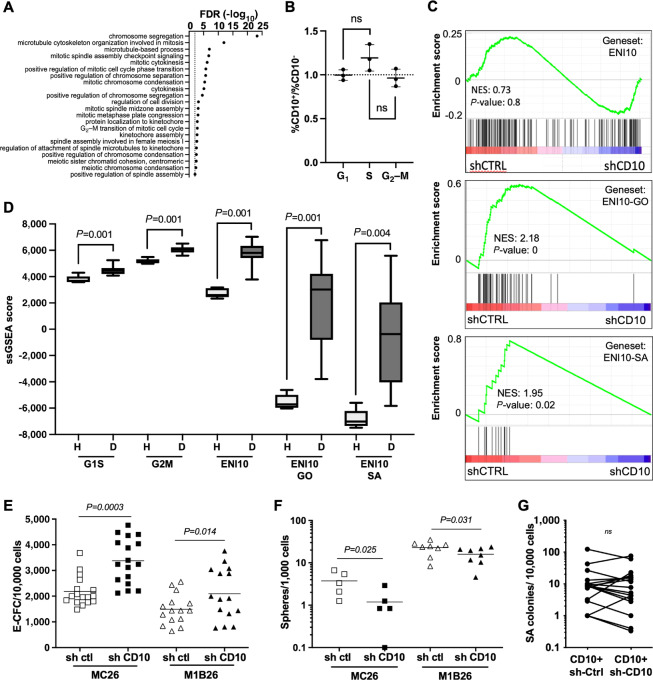
FIGURE 3.
The ENI10 molecular signature is enriched in genes involved in chromosome segregation during mitosis. A, GO analysis on the CD10 signature genes using the “Biological Process” terms. The most downstream terms in the hierarchy with an FDR less than 0.01 are shown. B, Ratio of the percentage of CD10+ over CD10-negative cells in each phase of the cell cycle determined by flow-cytometry analysis of MCF10A-Fucci-CA cells stained with an anti-CD10 antibody. C, GSEA using RNA-seq experiments comparing MCF10A cells expressing a scramble (shCTRL) or CD10 specific shRNA (shCD10), the gene sets used are the ENI10 genes (top), ENI10 genes belonging to all enriched GO terms shown in A (middle) and ENI10 genes belonging to the “mitotic spindle assembly checkpoint signaling” GO term (bottom). D, ssGSEA quantification of the indicated gene sets in normal healthy breast tissue (H) or in DCIS (D) from GSE21422 series. E, Quantification of E-CFC from CD10+ MC26 or M1B26 cells infected with lentiviruses carrying a scramble (sh ctl) or sh CD10 vector. F, Quantification of spheres forming cells from CD10+ MC26 or M1B26 cells infected with lentiviruses carrying a scramble (sh ctl) or sh CD10 vector. G, Quantification of soft-agar clones from M1B26 CD10+ cells infected with lentiviruses carrying a scramble (sh ctl) or sh CD10 vector.

