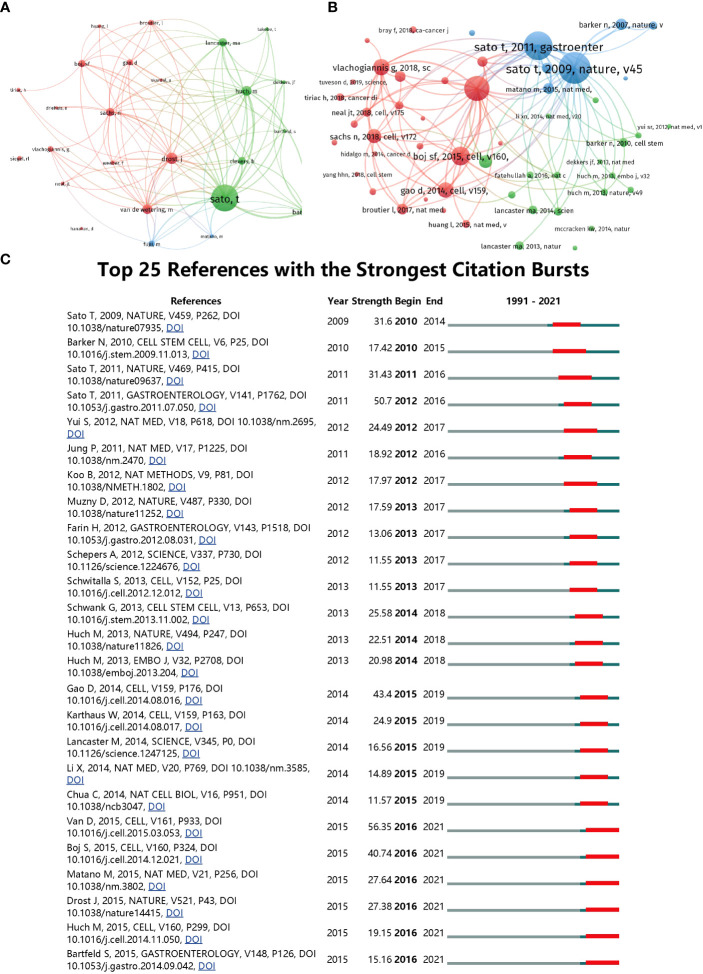
Figure 6.
(A) Mapping of the co-cited authors related to this field. (The points with different colors represent the identified authors. (B) Mapping of the co-cited references related to this field. (The points with different colors represent the cited references.) The size of burble represents the citation frequency. The shorter the line, the closer the link between two papers. The same color of the points represents the same research area they belong to. (C) Top 25 references with strongest citation bursts of publications related to organoids in cancer research.

