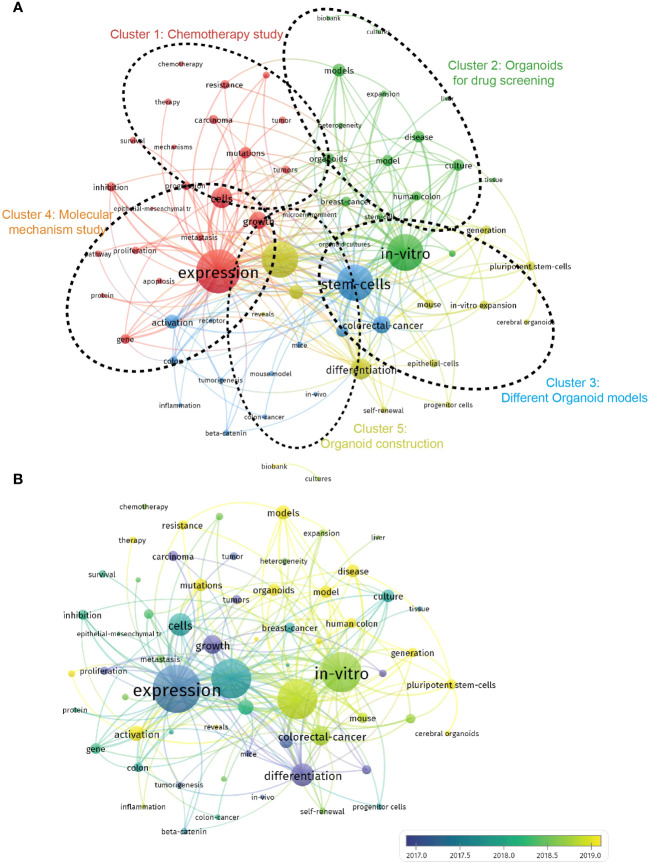
Figure 9.
Visualization of co-occurrence analysis based on organoids in cancer research. (A) Mapping of keywords in the research on organoids in cancer research; the frequency is represented by point size; The keywords of research fields were divided into five clusters by different colors: chemotherapy study (red), organoids for drug screening (green), different organoid models (blue), molecular mechanism study (orange), organoid construction (yellow). (B) Visualization of keywords distribution; The blue color represents an earlier appearance and yellow point appeared later.

