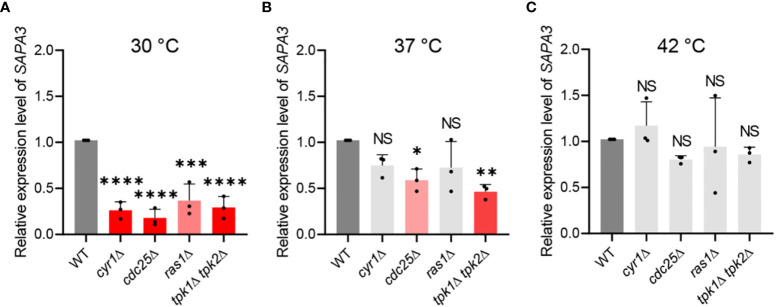
Figure 4.
Regulation of SAPA3 expression by the Ras/cAMP/PKA signaling pathway in C. auris. Quantitative reverse transcription PCR (qRT-PCR) analysis of SAPA3 in wild-type and mutants cyr1Δ (YSBA21), ras1Δ (YSBA41), cdc25Δ (YSBA61), and tpk1Δ tpk2Δ (YSBA24). Cells were cultured overnight at 30°C in YPD broth, subcultured to OD600 of 0.8 at (A) 30°C, (B) 37°C, and (C) 42°C in fresh broth, and extracted for total RNA. The expression level of SAPA3 was normalized using ACT1 as the standard. Three biologically independent experiments were performed. Error bars indicate standard deviation. Statistical analysis was performed using one-way ANOVA with Bonferroni’s multiple-comparison test (*P < 0.05; **P < 0.01; ***P < 0.001; ****P < 0.0001; NS, not significant).

