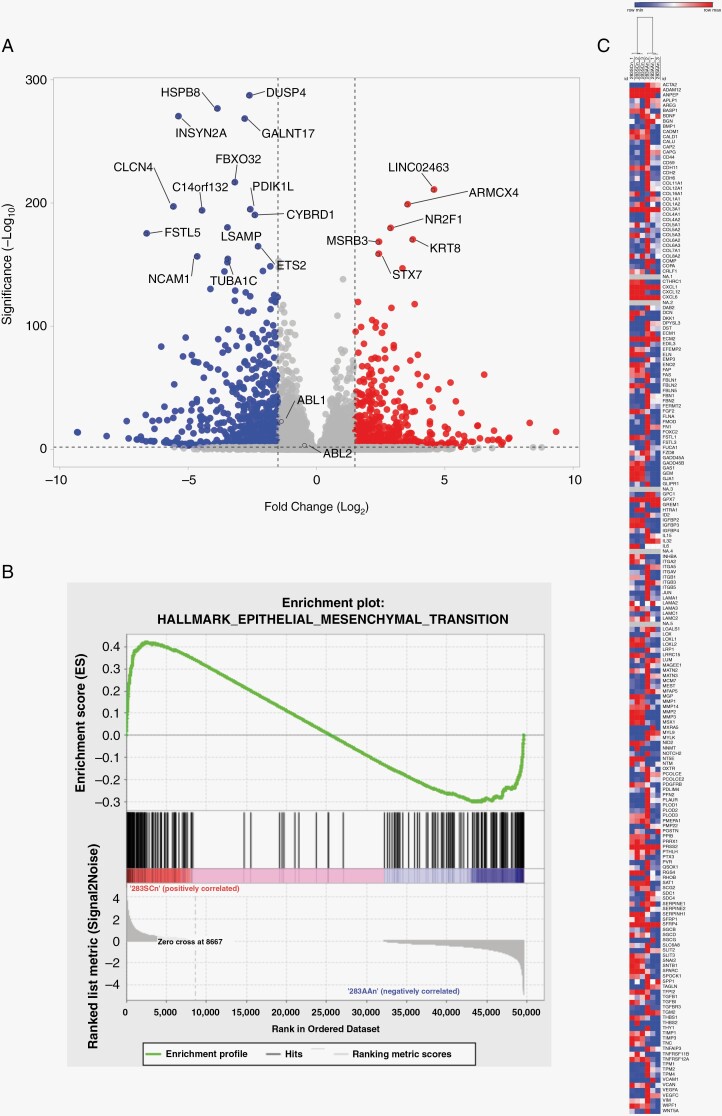
Figure 5.
Differential expression via RNA sequencing of D283 SCn and D283 AAn cells. (A) Volcano plot of differentially expressed genes in ABL1/2 knockdown cells (D283 AAn) and scrambled controls (D283 SCn). Blue represents decreased expression in ABL1/2 knockdown cells while red represents increased expression. Both ABL1 and ABL2 transcripts were significantly reduced in the double knockdown cells. ABL2 log2fold −0.4248, adjusted P = 7.74 × 10⁻⁴; ABL1 log2fold −1.32144, adjusted P = 1.66 10-22. (B) Gene set enrichment analysis enrichment plot of the single significant hallmark pathway: EPITHELIAL_MESENCHYMAL_TRANSITION. (C) Heatmap of the three D283 SCn samples, 2 columns each, and the 3 D283 AAn samples, 2 columns each. Hierarchical clustering demonstrates clustering into D283 SCn (left) and D283 AAn (right).

