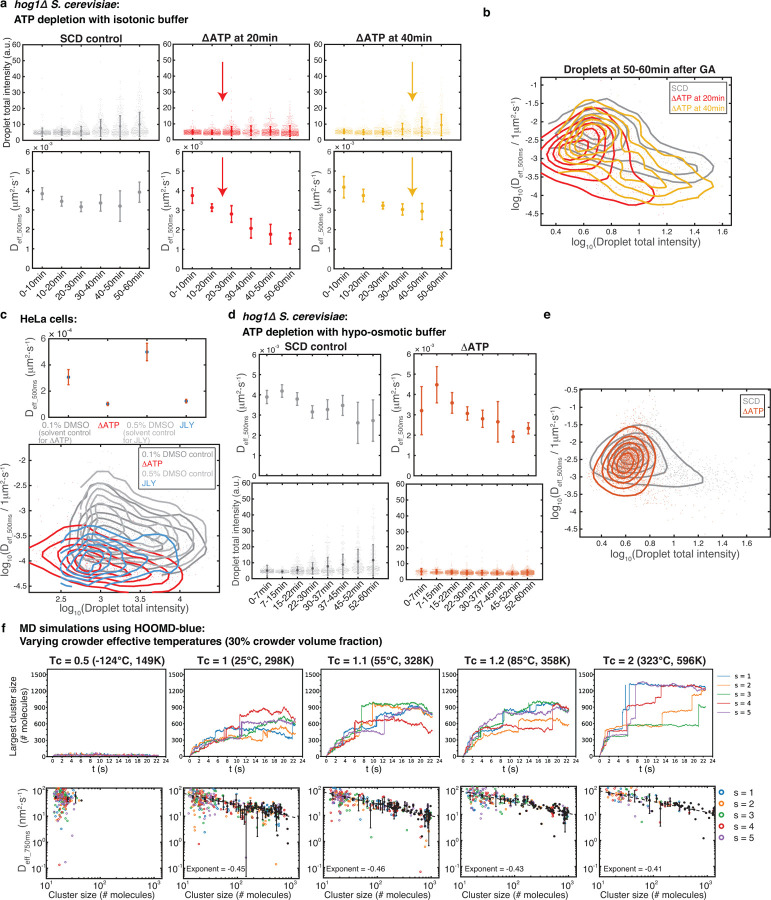
Fig. 3. ATP depletion inhibits synDrop growth.
a, Droplet formation in hog1Δ S. cerevisiae yeast cells in control conditions and after ATP depletion with isotonic buffer using 80mM sorbitol. ATP was depleted at two time points (indicated by arrows), 20 min and 40 min after synDrop induction with GA: (Top) Droplet total intensity, mean ± SD; (bottom) Median droplet diffusivity ± SEM. b, Density plot of individual droplet diffusivity versus its total intensity 50–60 min after induction. c, Properties of droplets that were pre-formed by one hour of GA induction with DMSO (solvent control) in mammalian HeLa cells and subsequently treated with the following conditions for one hour: ATP depletion, or the JLY cocktail (which freezes actomyosin dynamics): (Top) Median droplet diffusivity ± SEM; (bottom) Density plot of diffusivity versus total intensity for individual droplets. d, Droplet formation in hog1Δ S. cerevisiae yeast cells comparing control conditions to ATP depletion with a hypo-osmotic buffer: (Top) Median droplet diffusivity. Error bars are SEM; (bottom) Droplet total intensity: averaged values ± SD. e, Density plot of diffusivity versus total intensity for individual droplets at all time points postinduction. f, MD simulations using HOOMD-blue keeping a constant 30% crowder volume fraction but varying crowder effective temperatures. Values are shown relative to room temperature in units of Kelvin: 0.5, 1, 1.1, 1.2, 2: (Top) Number of molecules within the largest synDrop cluster over time from five replicate simulations; (bottom) Cluster diffusivity versus cluster size (number of molecules). The black data points are the mean of five replicate simulations, error bars are SD, dashed black line is the linear fit in log space with exponent (slope) labeled.

