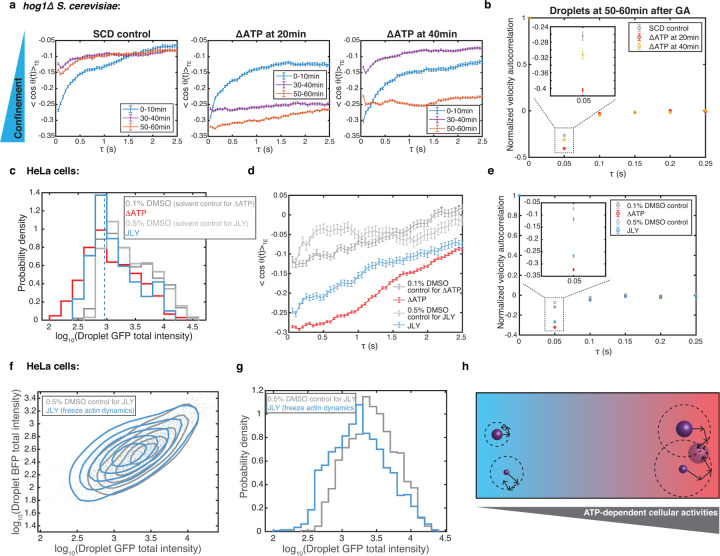
Fig. 4. ATP-dependent cellular activity facilitates droplet growth by promoting long-range cellular structural reorganization.
a, Angle correlation analyses on droplet trajectories at 0–10 min, 30–40 min and 50–60 min after synDrop induction with GA in hog1Δ S. cerevisiae yeast cells comparing control conditions to ATP depletion at 20 min and 40 min. Lower angle correlation values indicate greater confinement. b, Normalized velocity autocorrelation for droplet trajectories in hog1Δ S. cerevisiae yeast cells. Droplets were analyzed 50–60 min after synDrop induction. c, Histogram of droplet GFP total intensity for droplets that had formed after one hour of induction in mammalian HeLa cells comparing control (DMSO) to 1-hour ATP depletion or 1-hour JLY treatment (to freeze actin dynamics) conditions. Droplets with total intensities≤ 900 (blue dashed line) were used in subsequent analyses. d, Angle correlation analyses droplets that had formed after one hour of induction in mammalian HeLa cells. Droplets with total intensity ≤ 900 were analyzed after one hour of SynDrop induction. e, Normalized velocity autocorrelation for droplets that had formed after one hour of induction in mammalian HeLa cells. f, Phase diagram of synDrop BFP and GFP total intensities. Droplets were induced for 1–2 hours in the presence of control (DMSO) or JLY treatment. g, Histogram of droplet GFP total intensities (log scale). h, Model for how ATP-dependent cellular activities may influence droplet growth.

