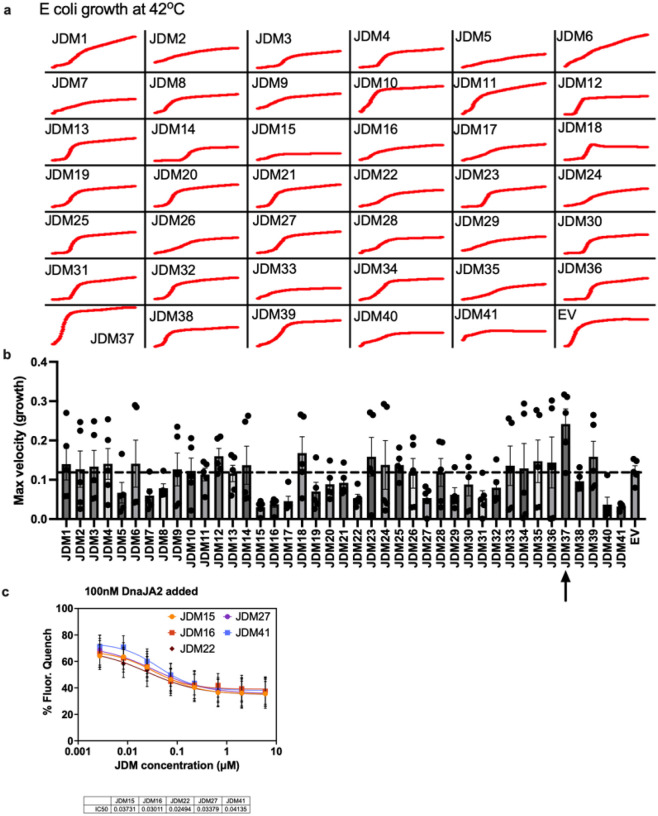
Extended Data Figure 6: Measuring the effect JDMs have on E. coli. cell growth.
a-b, The top 41 final JDM designs were transformed into E. coli., induced for expression, grown at 42°C, and their cell growth was tracked. Shown is a representative cell growth curve (a) or the average maximum growth velocity (b) (n=5 experiments). Dotted line is for empty vector expression as control. (c) The JDMs with the most consistent and dramatic inhibition of E. coli growth at 42°C were tested for inhibition of DnaJA2 (100nM) activation of Hsc70. IC50s are shown on the bottom with the units of μM.

