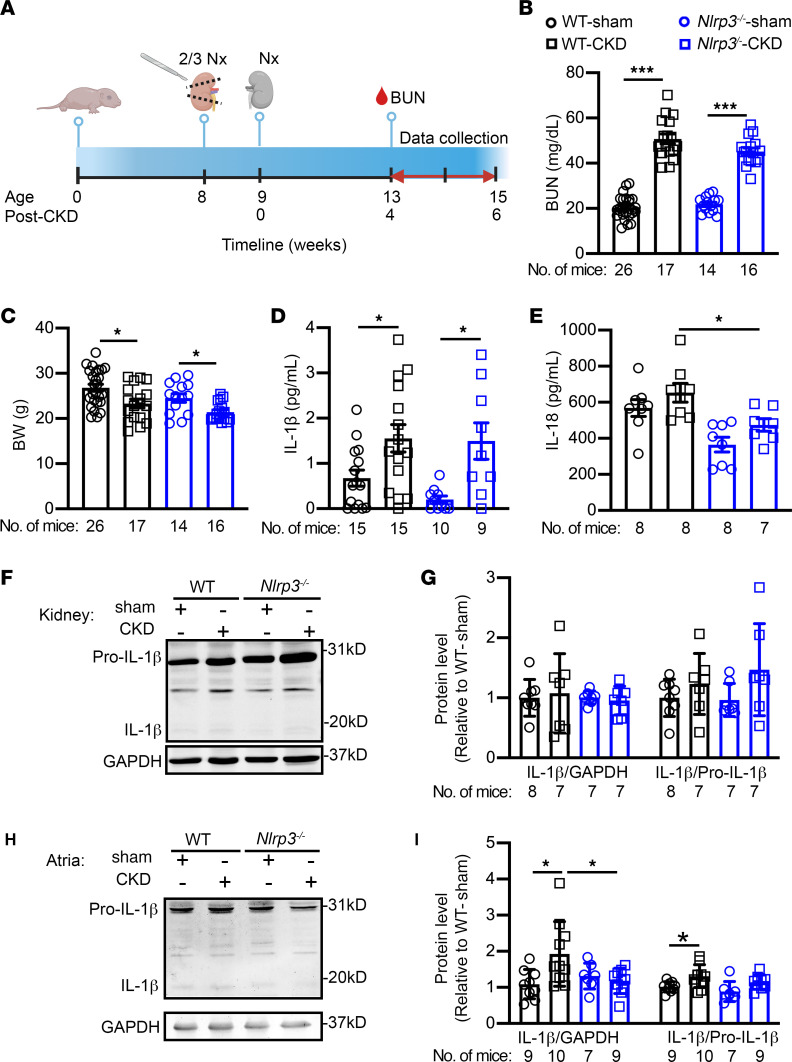
Figure 2. Murine model of CKD exhibits increased NLRP3 inflammasome activity.
(A) Timeline of the 2-stage subtotal nephrectomy to generate the CKD mouse model. The schematic was created with BioRender.com. (B) BUN levels and (C) BWs in WT and Nlrp3–/– mice subjected to sham or CKD procedures. (D and E) Serum levels of IL-1β and IL-18. (F) Representative Western blots and (G) quantification of IL-1β in kidney tissue. (H) Representative Western blots and (I) quantification of IL-1β in atrial tissue. Data are expressed as the mean ± SEM. *P < 0.05 and ***P < 0.001, by Welch’s ANOVA and Dunnett’s T3 multiple-comparison test (B and C) and ordinary 1-way ANOVA with Šidák’s multiple-comparison test (D and I).

