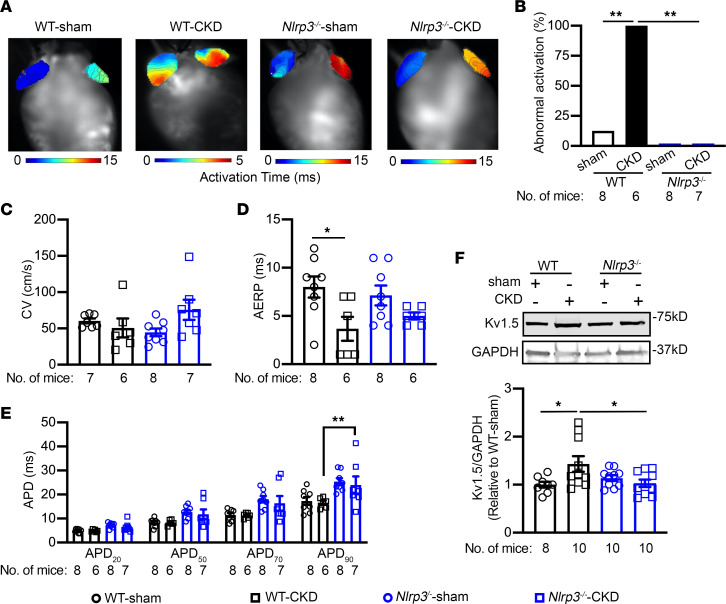
Figure 4. CKD promotes electrical remodeling for AF.
(A) Representative activation maps from an optical mapping study. (B) Incidence of abnormal activation patterns in each treatment group. (C and D) Summary of CV (C) in the RA and AERP (D) in atria of WT and Nlrp3–/– mice subjected to sham or CKD procedures. (E) APD at 20%, 50%, 70%, and 90% repolarization. (F) Kv1.5 protein levels in atria of WT and Nlrp3–/– mice subjected to sham or CKD procedures. Data are expressed as a percentage in B and as the mean ± SEM in C–F. *P < 0.05 and **P < 0.01, by Fisher’s exact test (B), ordinary 1-way ANOVA with Šidák’s multiple-comparison test (D and F), and 2-way ANOVA with Tukey’s multiple-comparison test (E).

