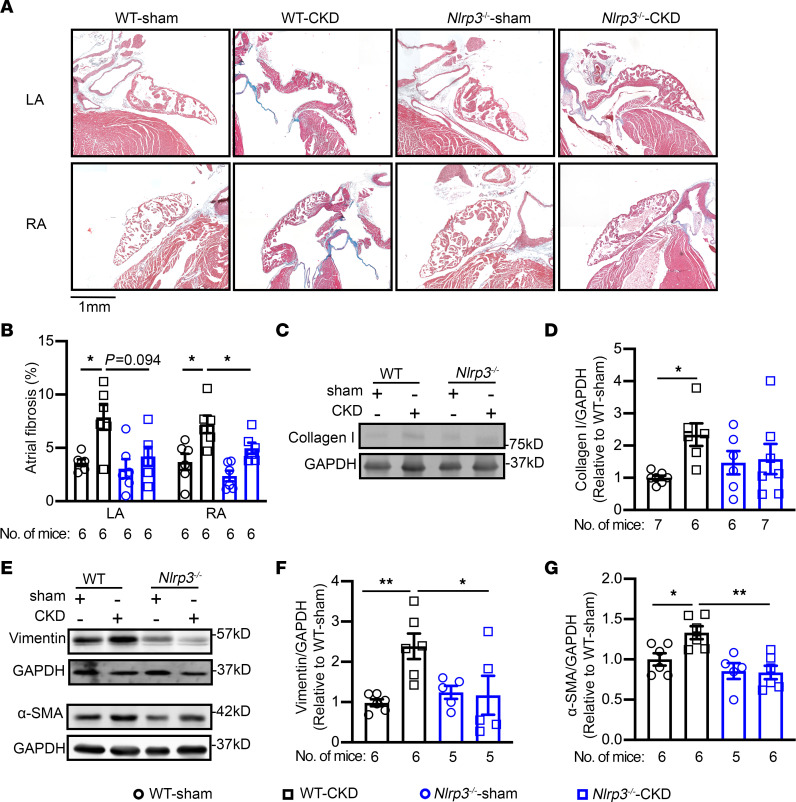
Figure 6. CKD promotes atrial fibrosis.
(A) Representative images of Masson’s trichrome staining of heart sections from WT and Nlrp3–/– mice subjected to sham or CKD procedures. Scale bar: 1 mm. (B) Quantification of fibrosis in the LA and RA of WT and Nlrp3–/– mice subjected to sham or CKD procedures. (C–G) Representative Western blots and quantification of collagen I (C and D), vimentin (E and F), and α-SMA (E and G). Data are expressed as the mean ± SEM. *P < 0.05 and **P < 0.01, by Welch’s ANOVA and Dunnett’s T3 multiple-comparison test (B) and ordinary 1-way ANOVA with Šidák’s multiple-comparison test (D, F, and G).

