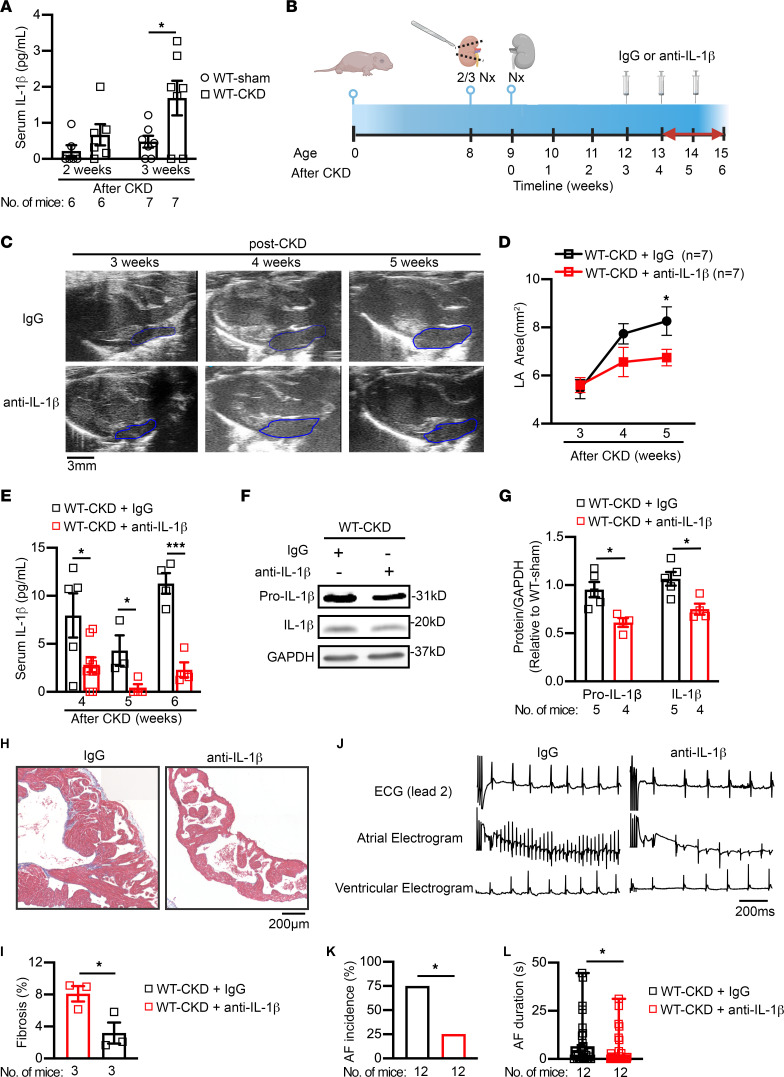
Figure 7. Neutralization of circulating IL-1β attenuates CKD-induced atrial arrhythmogenesis.
(A) Serum levels of IL-1β in WT mice 2 and 3 weeks after sham or CKD surgeries. (B) Timeline of anti–IL-1β antibody (5 mg/kg, i.p.) or IgG (as a control) injections into WT-CKD mice. 2/3 Nx, two-thirds nephrectomy. Panel B was created with BioRender.com. (C and D) Representative echocardiographic long-axis views of the heart (C) and quantification of the LA area (D) in WT-CKD mice that received IgG or anti–IL-1β antibody injections. Blue outlined areas indicate the LA. Scale bar: 3 mm. (E) Serum levels of IL-1β in WT-CKD mice that received IgG or anti–IL-1β antibody injections following the CKD procedure. (F and G) Representative Western blots (F) and quantification (G) of IL-1β in atrial tissue of WT-CKD mice after 3 weekly injections of IgG or anti–IL-1β antibody. (H and I) Representative images (H) of Masson’s trichrome staining in atria and quantification of atrial fibrosis (I) in WT-CKD mice after 3 weekly injections of IgG or anti–IL-1β antibody. Scale bar: 200 μm. (J–L) Representative lead 2 surface ECG and intracardial ECG recordings (J), incidence (K), and duration (L) of pacing-induced AF in WT-CKD mice after 3 injections of IgG or anti–IL-1β antibody. Scale bar: 200 ms (J). Data are expressed as the mean ± SEM in A, D, E, G, I, and L, and as a percentage in K. *P < 0.05 and ***P < 0.001, by unpaired, 2-tailed Student’s t test (A, D, E, G, and I), Fisher’s exact test (K), and Mann-Whitney U test (L).

