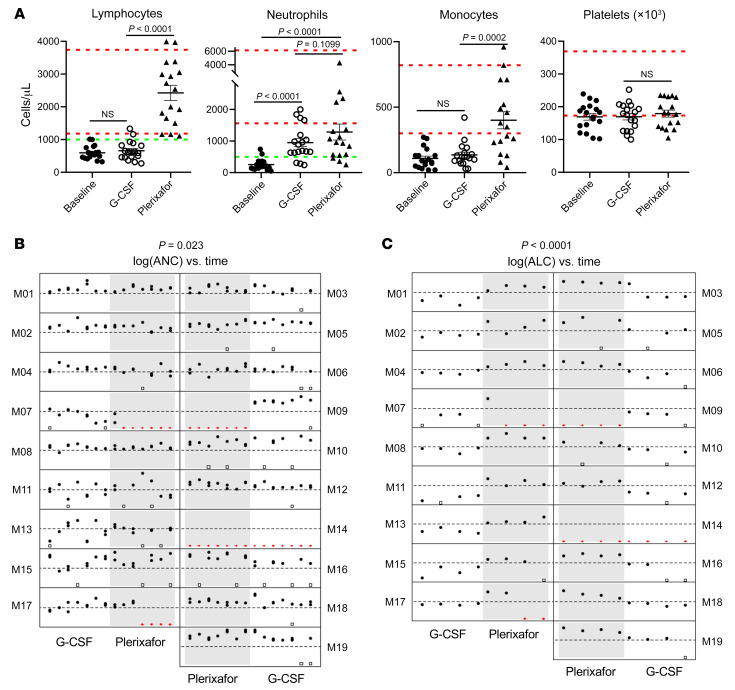
Figure 5. Effects of plerixafor versus G-CSF on circulating blood cell counts in patients with WHIM.
(A) Plerixafor, but not G-CSF, reversed panleukopenia without affecting circulating platelet concentration. Baseline refers to the day 0 value of the equilibration phase after 2-day washout of G-CSF or plerixafor from the preceding phase. G-CSF and plerixafor values are the final values obtained for the approximately 3-hour postmorning dose at the end of each treatment phase. Dashed green horizontal lines indicate the prespecified thresholds for judging success for improving neutropenia and lymphopenia. Each symbol represents a different patient. Dashed red horizontal lines demarcate the normal range for adults for each parameter established by the NIH-CC Department of Laboratory Medicine. P values were determined by a 2-sided Wilcoxon’s matched pairs rank test. (B and C) Plerixafor is noninferior to G-CSF for durably reversing neutropenia and is superior to G-CSF for durably reversing lymphopenia for 1 year. Filled black circles indicate individual values at the indicated times; open black squares indicate missing values due to scheduling conflicts; and red triangles indicate missing data due to drug failure. The y axes are on a log scale from 50 to 5,000 for ANC and from 100 to 10,000 for ALC. The thresholds for judging success are indicated by dashed horizontal lines at 500 and 1,000 cells/μL for ANC and ALC, respectively. P values (at the top of each panel) were determined by a Wilcoxon’s matched pairs rank test, as specified in the Supplemental Statistical Analysis Plan and the Supplemental Statistical Analysis Plan Supplement.

