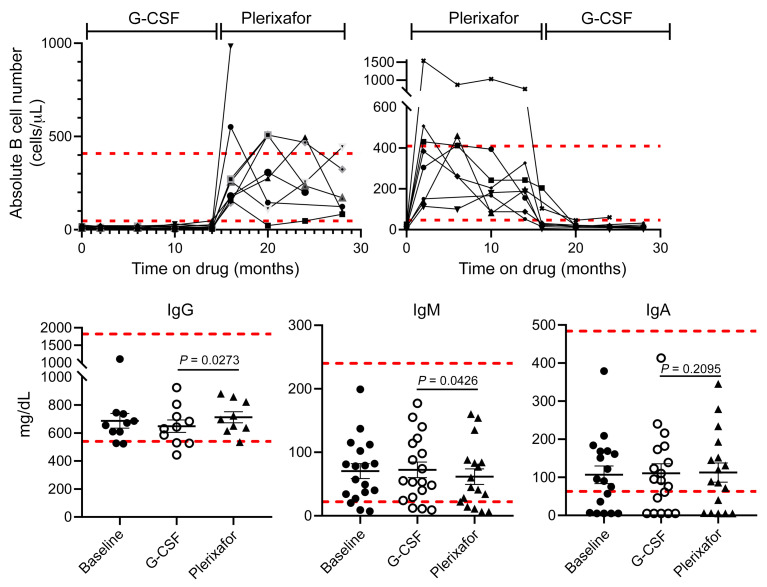
Figure 6. Normalization of circulating B cell levels by plerixafor did not affect immunoglobulin levels.
Dashed horizontal lines demarcate the normal range for each parameter established by the NIH-CC Department of Laboratory Medicine. Top: B cells. The time on each drug includes both equilibration and treatment phases and is indicated at the top by brackets. Each graphed line represents data for a single patient. Bottom: Immunoglobulin levels. G-CSF and plerixafor data designate the final value obtained at the end of each treatment phase. IgG data are only shown for patients not receiving supplemental immunoglobulin. P values are only shown for the drug comparisons and were determined by a 2-sided Wilcoxon’s matched pairs rank test. Comparisons of day –0 baseline data to data on each drug were not significant.

