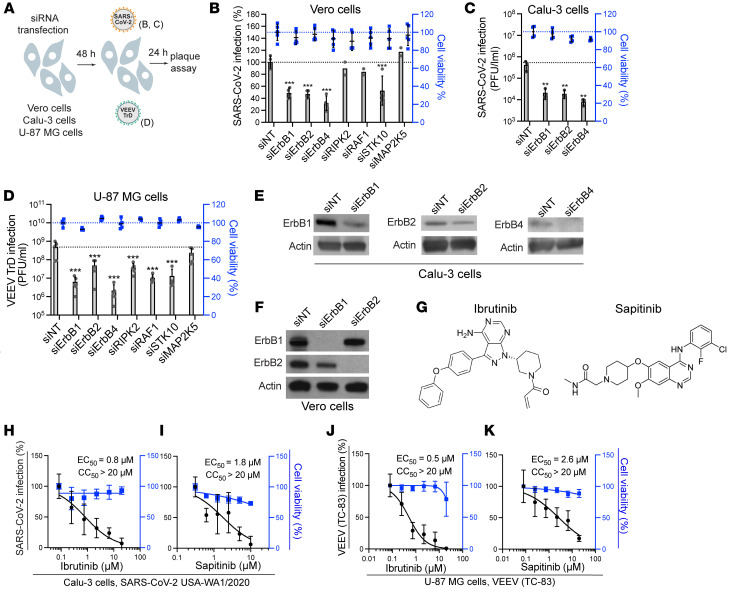
Figure 4. ErbBs are essential for SARS-CoV-2 and VEEV infections.
(A) Schematic of the experiment shown in B–D. (B) Percentage of infection by plaque assays (gray) and cell viability by alamarBlue assays (blue) in Vero cells transfected with the indicated siRNA pools measured at 24 hours after infection with WT SARS-CoV-2. (C and D) Viral titers (gray) and cell viability (blue) in Calu-3 (C) and U-87 MG (D) cells transfected with the indicated siRNA pools measured at 24 hours after infection with WT SARS-CoV-2 (C) or VEEV (TrD) (D). (E and F) Confirmation of siRNA-mediated gene expression knockdown in Calu-3 (E) and Vero (F) cells at 48 hours after transfection by Western blot. Notably, 2 anti-ErbB4 antibodies detected no signal of endogenous protein in Vero cells. (G) Chemical structures of ibrutinib and sapitinib. (H–K) Dose response to ibrutinib (H and J) and sapitinib (I and K) of SARS-CoV-2 (black, USA-WA1/2020 strain, MOI = 0.05) (H and I) and VEEV (TC-83) (J and K) infection by plaque assays and cell viability (blue) by alamarBlue assays at 24 hours after infection of Calu-3 (H and I) or U-87 MG (J and K) cells. Data are representative (C) or a combination (B, D, and H–K) of 2 independent experiments with 2–3 replicates each. Means ± SD are shown. Data are relative to DMSO (H–K) or siNT (B–D). **P = 0.003, ***P < 0.001 by 1-way ANOVA followed by Dunnett’s multiple-comparison test.

