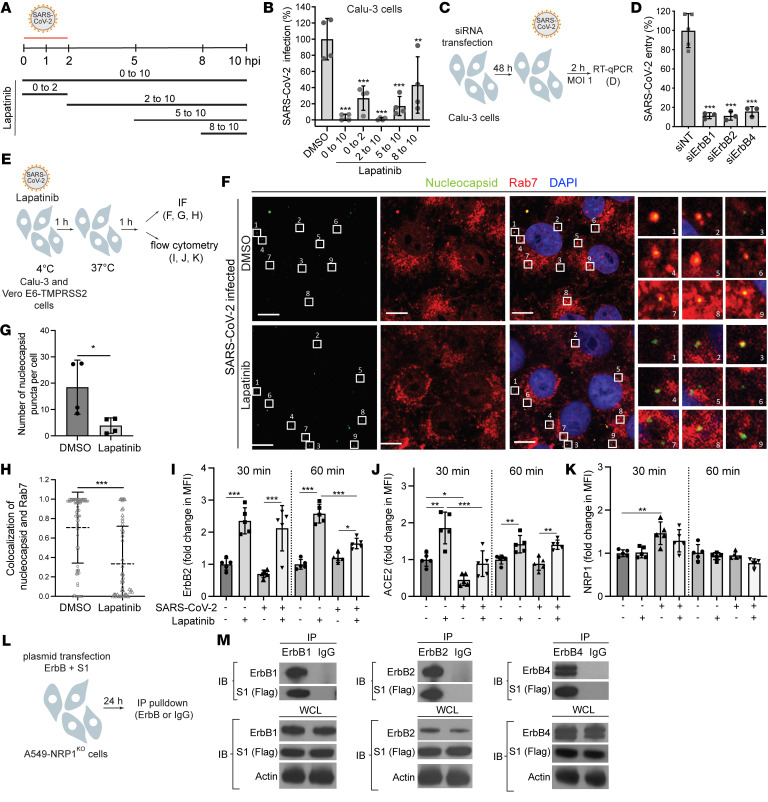
Figure 5. ErbBs bind the viral spike S1 subunit, and their inhibition suppresses SARS-CoV-2 and ACE2 internalization.
(A) Schematic of the time-of-addition experiment shown in B. (B) Calu-3 cells were infected with SARS-CoV-2 (MOI = 1). At the indicated times, 10 μM lapatinib or DMSO was added. Supernatants were collected at 10 hpi, and viral titers were measured by plaque assay. Values are shown relative to DMSO control. (C) Schematic of the experiment shown in D. (D) WT SARS-CoV-2 entry at 2 hpi in Calu-3 cells (MOI = 1) depleted of the indicated ErbBs measured by RT-qPCR. (E) Schematic of the experiments shown in F–K. (F–H) Quantitative IF analysis of SARS-CoV-2 internalization. Vero-TMPRSS2 cells were pretreated with lapatinib (10 μM) or DMSO and infected with SARS-CoV-2 (MOI = 1) at 4°C for 1 hour followed by temperature shift to 37°C. At 1 hpi, cells were fixed and labeled with nucleocapsid (green) and Rab7 (red) antibodies. The right panel shows the numbered areas magnified 6-fold. Scale bars: 10 μm. (G) Number of nucleocapsid puncta per cell after DMSO and lapatinib treatment. (H) Scatter plots of colocalization of nucleocapsid and Rab7 quantified by Manders’ coefficient. Dots represent individual viral particles; horizontal lines indicate means ± SD (DMSO: n = 71; lapatinib: n = 53). (I–K) Flow cytometry data of cell surface expression levels of ErbB2 (I), ACE2 (J), and NRP1 (K) at 30 and 60 minutes after temperature shift to 37°C in uninfected and SARS-CoV-2–infected Calu-3 cells treated with lapatinib or DMSO. Fold change in MFI is relative to 30-minutes uninfected DMSO-treated cells. (L) Schematic of the experiment shown in M. (M) A549-NRP1KO cells were cotransfected with plasmids expressing S1-FLAG and ErbBs, followed by immunoprecipitation using anti-ErbB or IgG antibodies and protein G Dynabeads. Representative Western blots of eluates and whole-cell lysates (WCL) are shown. Data are representative (D, F–H, and M) or a combination (B and I–K) of 2 independent experiments with 2–5 replicates each. Means ± SD are shown (B, D, and G–K). Data are relative to DMSO (B and G–K) or siNT (D). *P ≤ 0.05, **P < 0.01, ***P < 0.001 by 1-way ANOVA followed by Dunnett’s (B and D) or Tukey’s (I–K) multiple-comparison test or by unpaired, 2-tailed Student’s t test (G and H).

