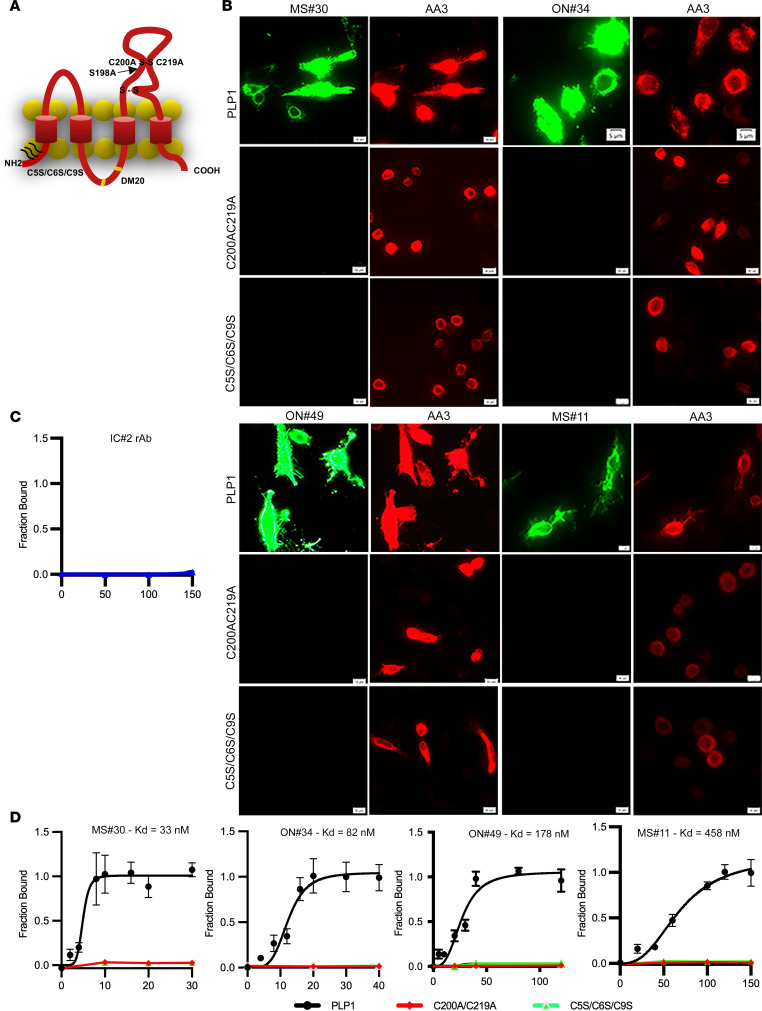
Figure 5. Myelin-specific MS rAbs recognize complex PLP1 antigens.
(A) Schematic of extracellular and intracellular mutations introduced into PLP1. (B) Immunofluorescence images of MS#30 (20 µg/ml), ON#34 (40 µg/ml), ON#49 (50 µg/ml), and MS#11 (100 µg/ml) rAb binding to live cells expressing WT PLP1 or PLP1 containing mutations in the second extracellular domain (C200A/C219A) or N-terminal cysteines (C5S/C6S/C9S). Scale bars: 5 μm. (C) Quantitative assay shows absence of IC#2 rAb binding (μg/ml) to live cells expressing WT PLP1. (D) Quantitative binding (mean ± SEM) of MS#30, ON#34, ON#49, and MS#11 rAbs (μg/ml) to cells expressing WT or mutated PLP1. Apparent KD are reported for each experimental curve.

