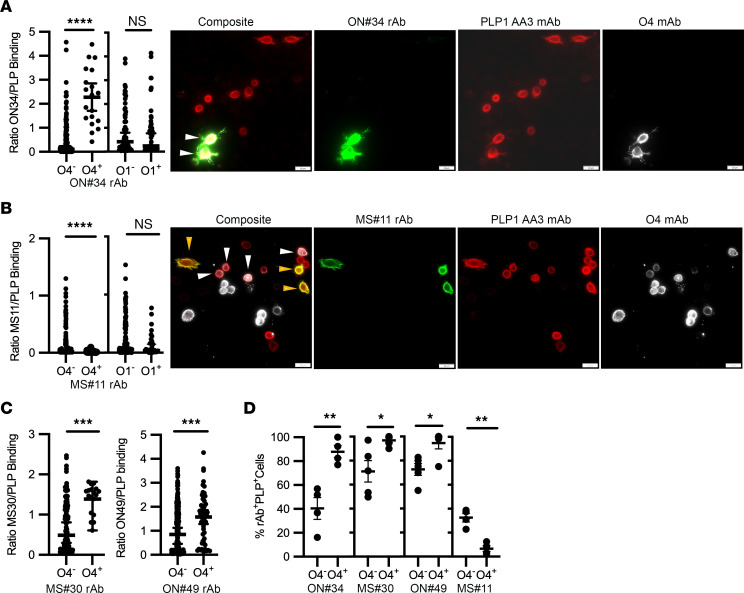
Figure 7. Sulfatide and cholesterol levels modify binding of MS rAbs to PLP1-expressing cells.
(A) Quantitation and representative images of ON#34 rAb binding to PLP1+ CHOK1 cells coexpressing sulfatide (O4) or galc (O1). Scale bars: 20 μm. The binding intensity ratio of ON#34 rAb (green, G) to PLP1 mAb (red, R) (G/R ratio) is plotted (median ± 95% CI) for single PLP1+ cells (n = 19 PLP1+O4+ and 131 PLP1+O4– cells; n = 52 PLP1+O1– and 65 PLP1+O1+ cells) and significance established using Welch’s t test. White arrowheads on images identify ON#34+O4+PLP1+ cells. (B) Representative images and quantitation of MS#11 rAb binding to PLP1+ CHOK1 cells coexpressing sulfatide or galc. The ratio of MS#11 (green) to PLP (red) is plotted (median ± 95% CI) for PLP1+ cells binned according to O4 (n = 161 PLP1+O4– and 45 PLP1+O4+ cells) or O1 expression (n = 145 PLP1+O1– and 34 PLP1+O1+ cells) and significance established using Welch’s t test. White arrowheads identify MS#11–O4+PLP1+ and gold arrowheads MS#11+O4–PLP1+ cells. (C) The binding ratios of MS#30 (green) or ON#49 (green) to PLP (red) are plotted (median ± 95% CI) for PLP1-expressing CHOK1 cells binned for O4 expression (MS#30: n = 127 PLP1+O4– and 18 PLP1+O4+ cells; ON#49: n = 249 PLP1+O4– and 50 PLP1+O4+ cells). Significance was established using Welch’s t test. (D) Quantification (mean ± SEM) of the percentage of PLP1AA3-expressing cells positive for MS rAb staining (determined by G/R ratio) according to the visual presence or absence of coincident O4 mAb staining. Values represent measurements from 4 to 5 independent experiments per MS rAb. *P < 0.05; **P < 0.01; ***P < 0.001; **** P < 0.0001, Welch’s t test.

